Loading, preparing and running tests
Foretify Developer is a web-based application that opens in your default browser. It is designed to guide you through the steps of:
- Loading a test.
- Preparing a test.
- Executing a run.
- Debugging a run.
Invoke Foretify Developer
Before invoking Foretify Developer, you should:
- Create the source files for the test using your favorite editor.
- Set Google Chrome as your default browser.
- [Optional] Set the OSC_PATH environment variable to include the path to your OSC2 source files. For example:
$ export OSC_PATH="/work/myuser/sandbox"
To invoke Foretify Developer on localhost:
Execute this command at the shell prompt:
$ foretify --gui &
To invoke Foretify Developer on a remote host:
-
Execute this command at the shell prompt on the remote host:
Shell command: invoke Foretify Developer2. In a browser tab on the localhost, type the remote host IP and the port displayed by Foretify in the URL field.$ foretify --server & Checking license... License check succeeded Foretify server is listening on port 41261 $Browser URL input<IP>:<port>
Foretify Developer opens in a new tab in the browser on the localhost.
For a list of other invocation options, see Foretify invocation.
For an explanation of how to use a YAML file to configure a run, see Foretify configuration.
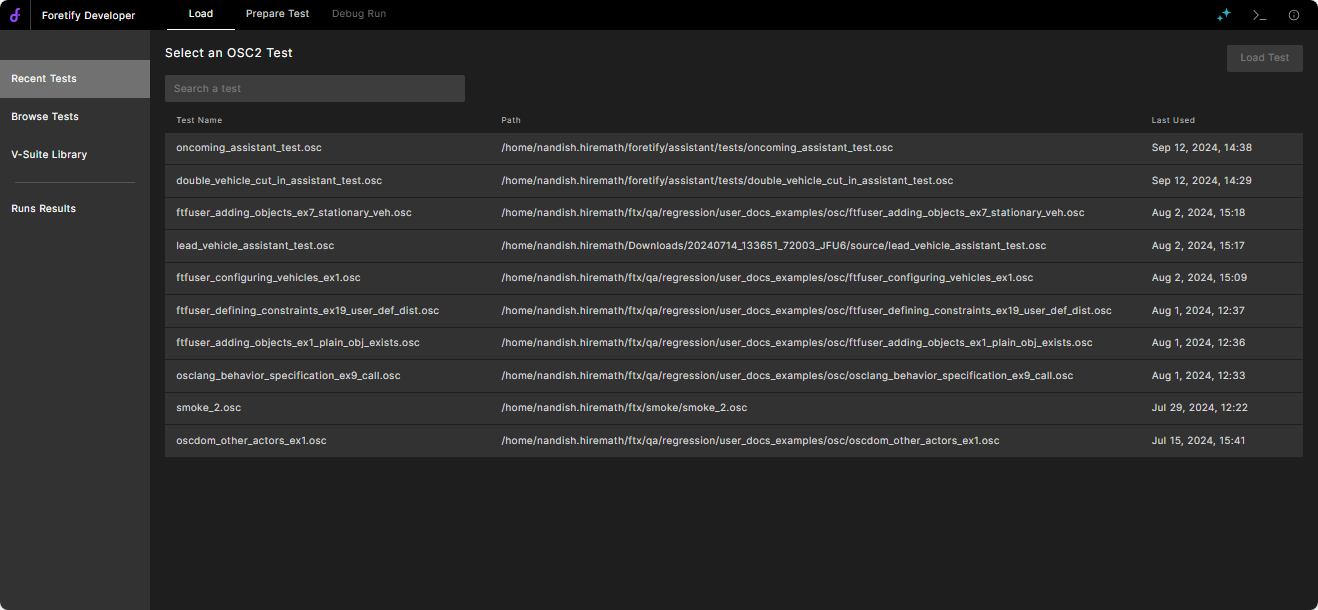
Load a test
To load a new test file:
- Click Browse.
-
Select the test and click Load Test.
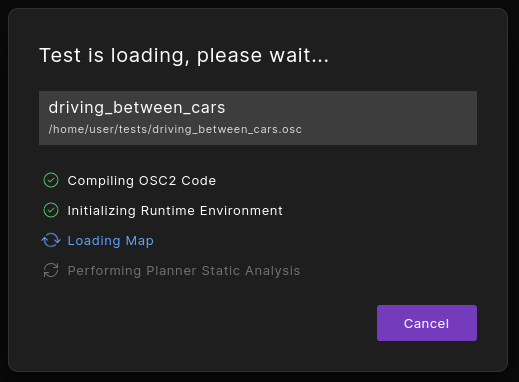
Foretify Developer displays the status of the loading process.
See Writing and executing tests for more on tests.
To reload a recently loaded test:
- Click Recent Tests.
- Select the test and click Load Test.
Foretify Developer displays the status of the loading process.
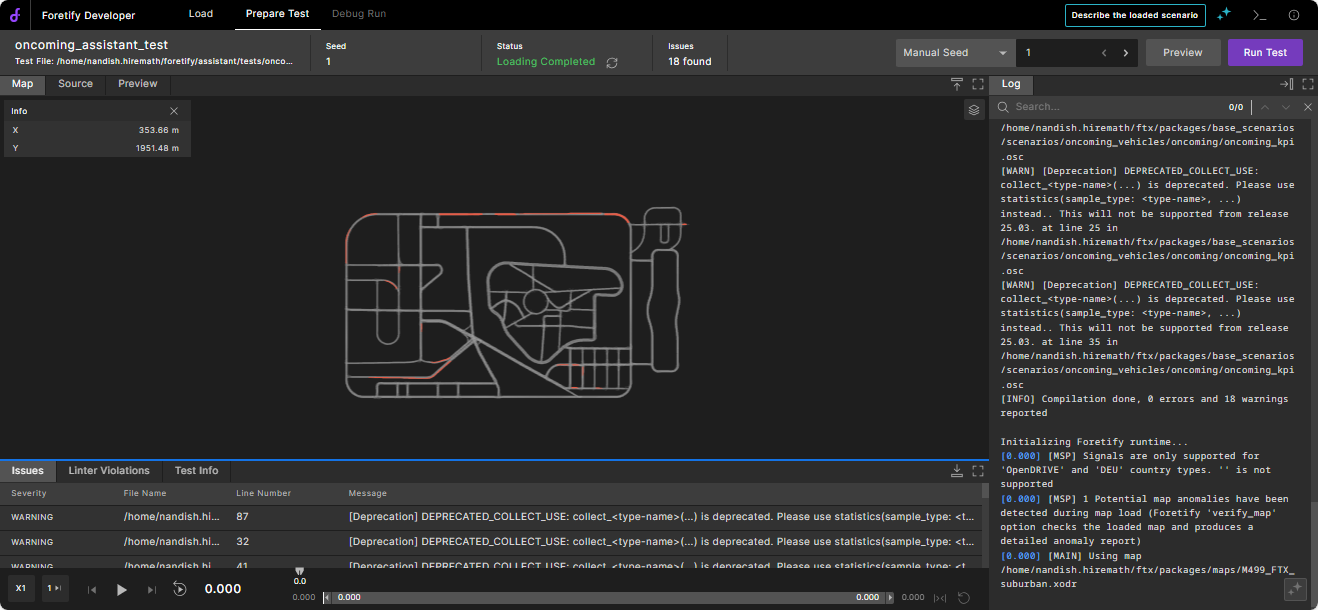
Prepare a test
When the loading process completes, Foretify Developer displays the Prepare Test tab.
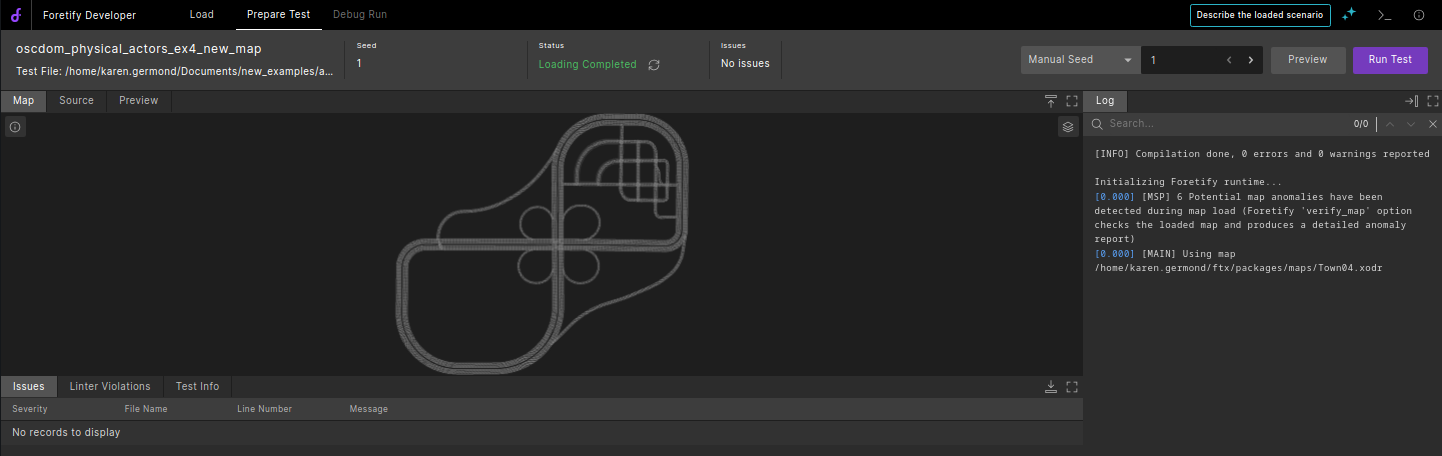
If the test loads without error, you can execute a run immediately. Alternatively, you can:
- View the Map frame to confirm that the loaded map is appropriate for this test.
- Open the Preview frame and click Preview on the top right to view a preview of the run before it executes.
- Edit the source files for the test in your favorite editor to resolve load-time issues.
Note
You can maximize or minimize most frames within the Prepare Test tab using the Maximize and Minimize icons at the top right corner of the frame.
Execute a run
To execute a run of the test:
-
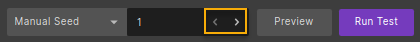
Type a number in the Manual Seed field, or select Random seed to generate a random seed for the run.
You can also update the seed using the increment and decrement icons in Manual Seed mode:
-
Click Run Test.
Debug load-time issues
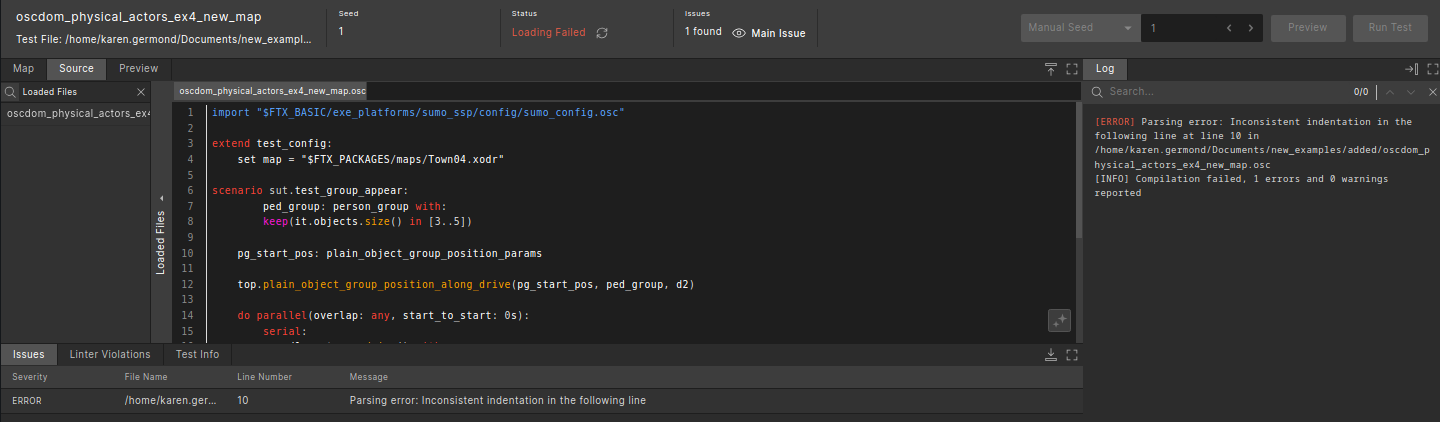
Issues that arise during the loading process are displayed in the Issues frame at the bottom of the Prepare Test tab.
To debug a load-time issue:
- Use the list of Loaded Files in the Source frame to find and view the file with the problem code.
- View the Issues frame below the Source frame to see the file name, line number and message for the issue.
- Edit the source files in your favorite editor.
- Open the Load tab and load the edited test.
For more information on how to resolve some common load-time issues, see kind.
Inspect linter violations
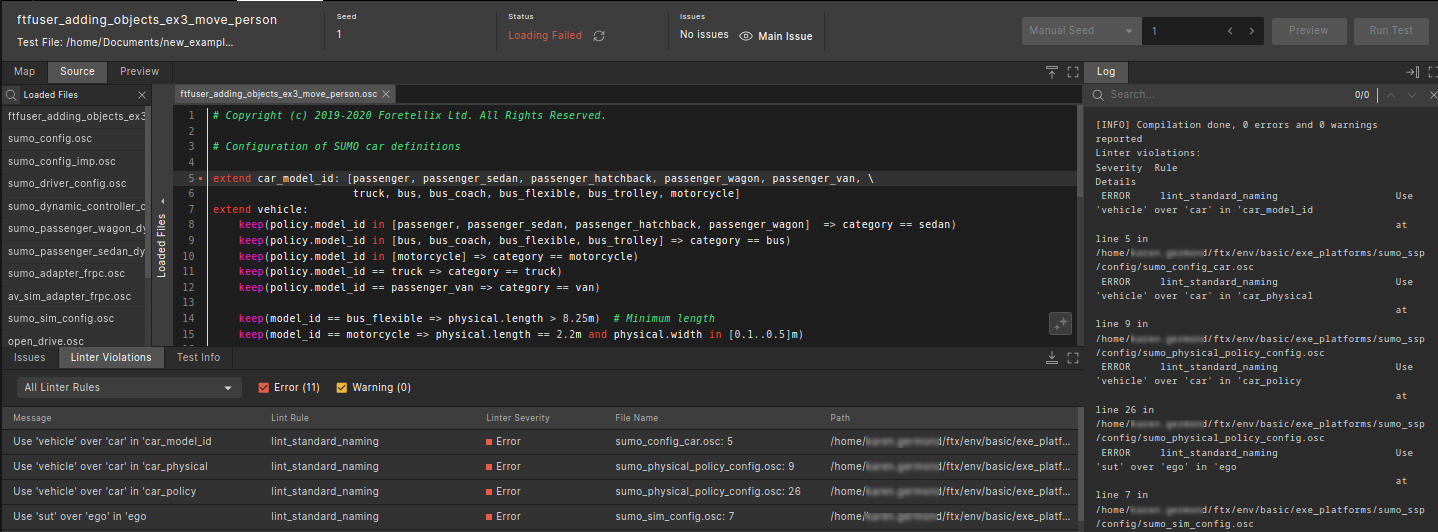
Linter violations that arise during the loading process are displayed in the Linter Violations frame at the bottom of the Prepare Test tab.
To inspect a linter violation:
- Use the linter rules filter to filter violations by rule name.
- Use the linter severity filter to filter violations by severity.
- Click on any column header to sort the violations table by that column.
- Click on a row in the linter violations table to navigate to the line in the source file where the violation occurred.
- Source code lines with linter violations are highlighted in the source viewer with an indication on the margin of the line. Hover over the indication to see the violation message.
For information on how to enable and use linter rules, see Using the Foretify Linter.
View the map
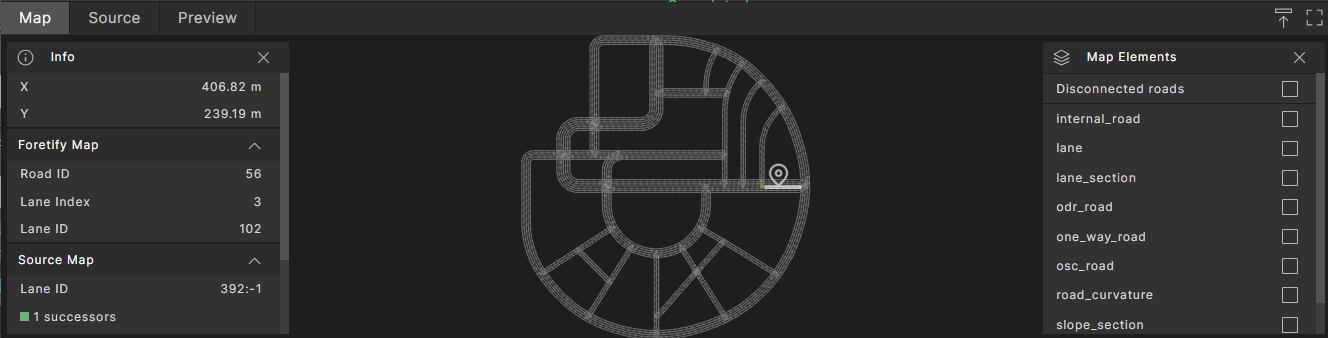
The currently loaded map is displayed in the Map tab.
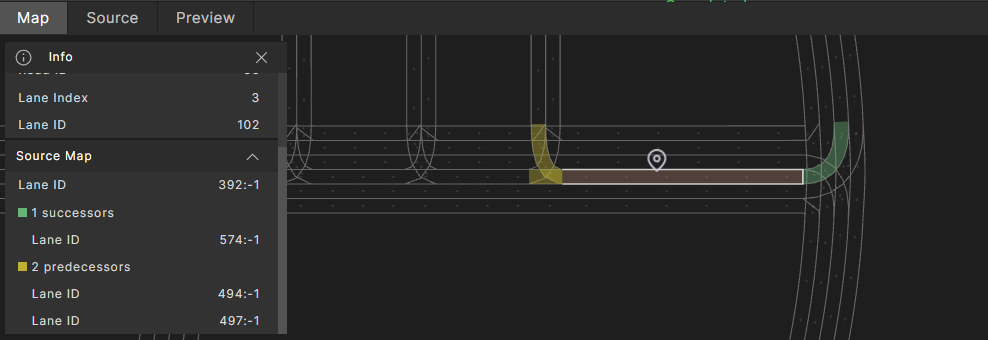
To see the attributes of a selected road element:
- Click the Info (i) icon at the top-left corner of the Map.
- View detailed information about road elements in the Info list:
- X and Y display the road coordinates on the map.
- Foretify Map shows the Road ID, Lane ID and Lane Index as they are represented internally in Foretify's MSP format.
-
Source Map shows the road's Lane ID as well as the Lane IDs for the road's successor and predecessor roads as they are represented in the source map's format.
When clicking on a lane, the predecessor and successor lanes are highlighted on the map.
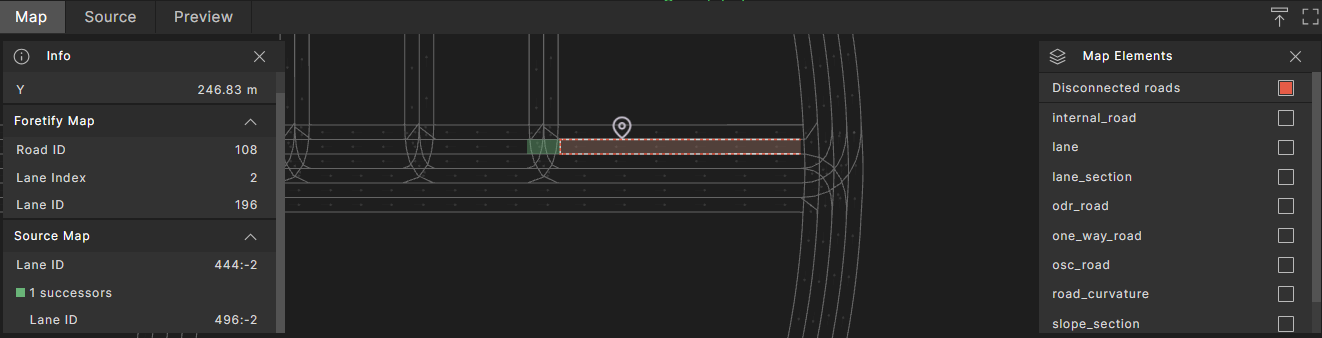
To find a road element of a selected type:
- Click the Map Elements (stack) icon at the top-right corner of the Map.
- In the Map Elements list, select the road element type you want to focus on. Elements of the selected type are highlighted in various colors.
To display disconnected roads:
- Click the Map Elements (stack) icon at the top-right corner of the Map.
-
Select Disconnected roads to show lanes that do not have successor or predecessor lanes.
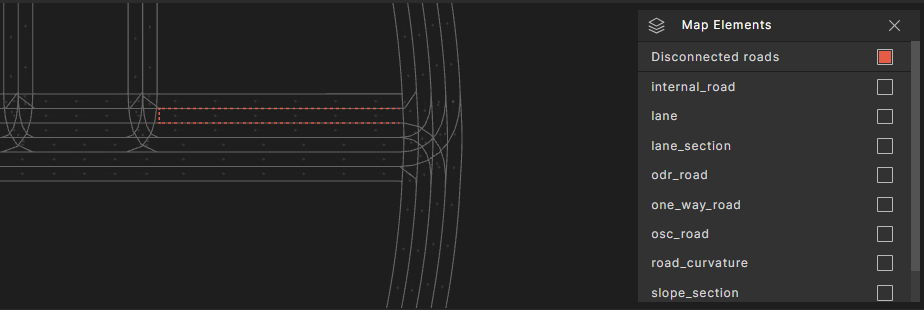
In many cases, when such disconnected roads appear, they indicate anomalies in how the map was constructed and are a common source of test failures.
-
Click on the disconnected road to reveal its missing connectivity and help debug issues.
Preview a run
Before executing a test, you can preview a run to get a sense of how the scenario will play out. You can see how the actors controlled by Foretify will behave and how the SUT will move without having to run a complete simulation.
To preview a run:
-
Select the Preview tab (on the right side of the Source tab).
-
Enter a seed in the Manual Seed entry on the top-right or select Random Seed from the drop-down menu.
You can also update the seed using the increment and decrement icons in Manual Seed mode.
-
Click the Preview button on the top right.
-
Once the Preview is ready for the selected seed, click the Play button on the bottom-left of the Preview pane to view a visualization of the plan.
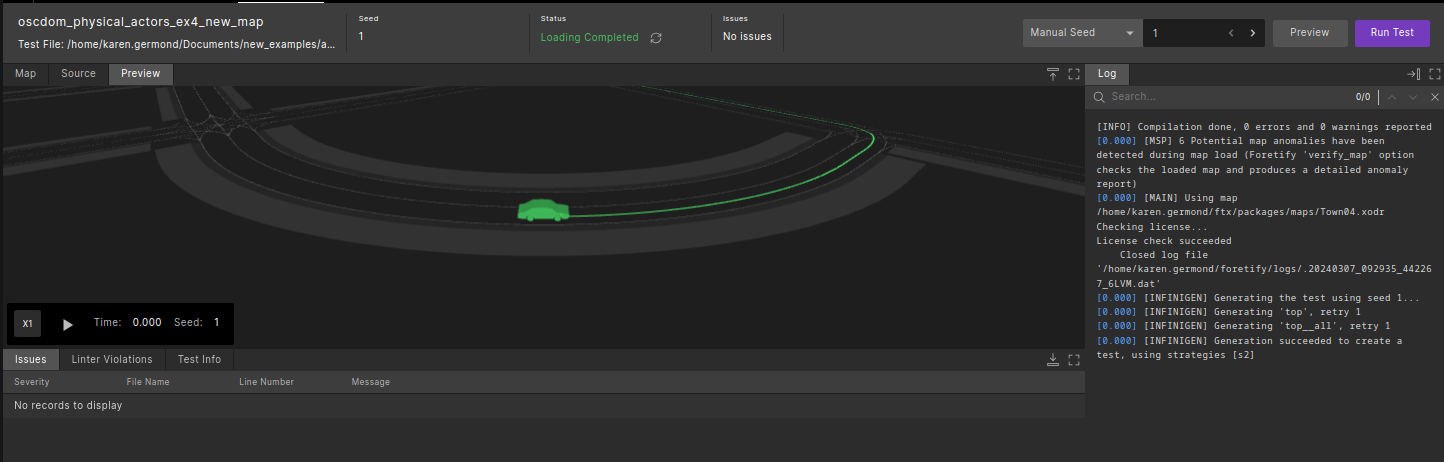
-
Try other seeds and click Preview to visualize different scenario outcomes.
Use the debugger
When a run completes, the Debug Run tab is displayed.
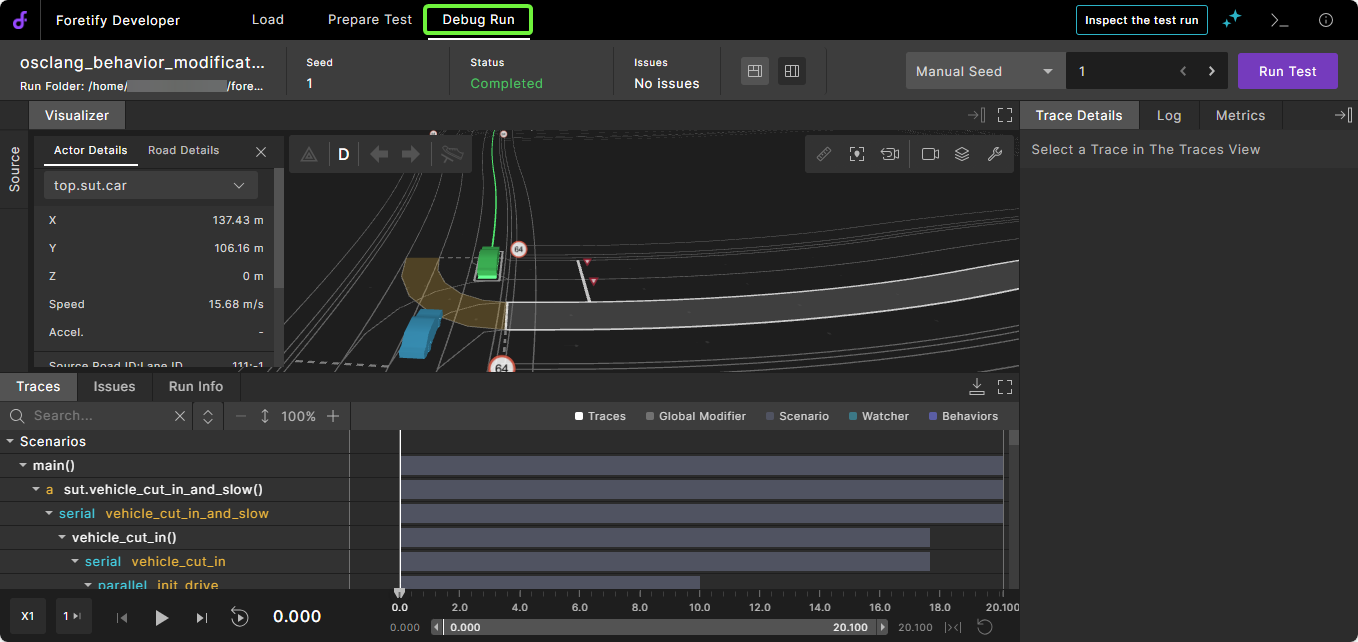
The debugger provides the following tools:
- The Visualizer displays the actors on the map.
- The Source view displays the source code of the run.
- The Traces view displays the values of the traced parameters, as well as interval visualization that represents abstract data over a time span.
- Issues that occurred during the run are listed in the Issues frame below the Visualizer.
- The basic run information is displayed in the Run Info view.
- Each interval details are displayed in the Trace Details view.
- Logs are displayed in the Log view.
- Metrics and KPIs are displayed in the Metrics view.
To learn how to use the debugger, see Debugging a run.
Loading a V-Suite scenario
Foretify provides direct access to available V-Suite scenarios (Foretify searches for scenarios in the folder $FTX/packages) to load them easily. The provided scenarios are configured with default maps and simulators, so they can be launched as is.
-
Select V-Suite Library.
Result: The scenarios within the V-Suite library are displayed.
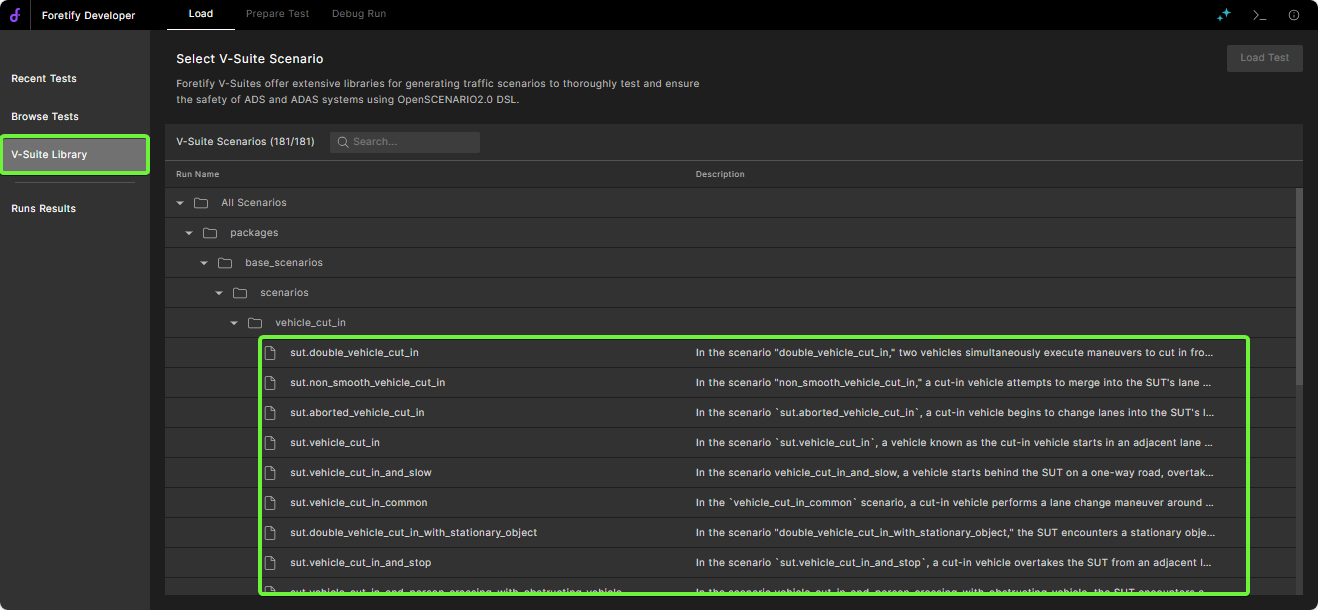
-
Select a scenario from the library tree, and click Load Test.
Here, you can search for the scenario by its name using the search box.

Result: The scenario will be loaded and displayed under the Prepare Test page.
-
Click Preview to preview the run, and Run Test to debug it.
Load a previous run to review or rerun
-
Click the Load tab on the top left.
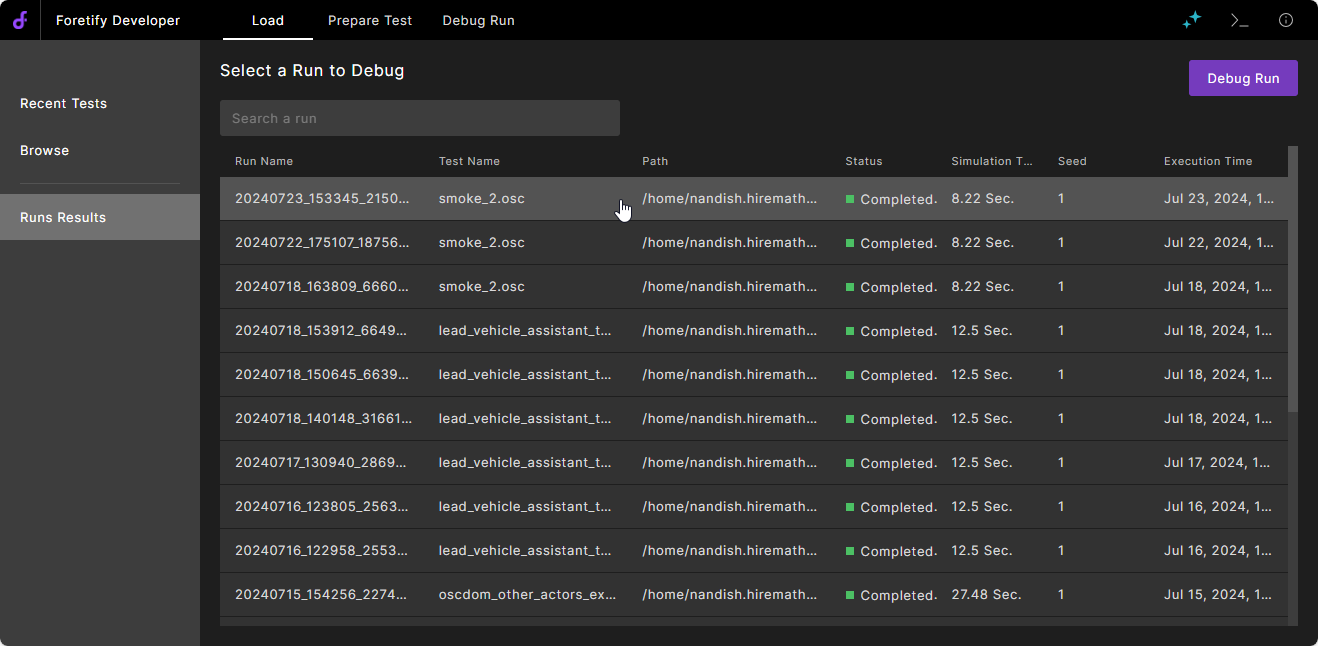
-
Select the run and click Debug Run on the top right.
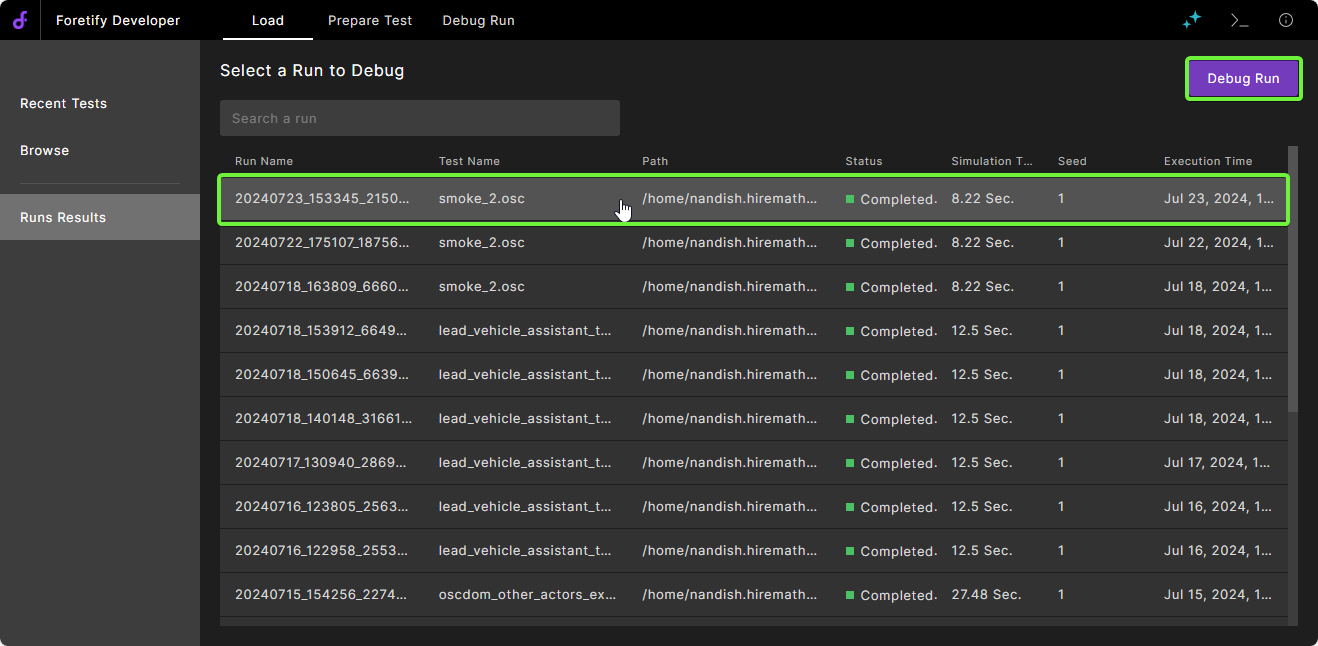
Foretify Developer displays the selected run in the Debug Run tab.
-
If you want to re-execute the run, click Rerun.
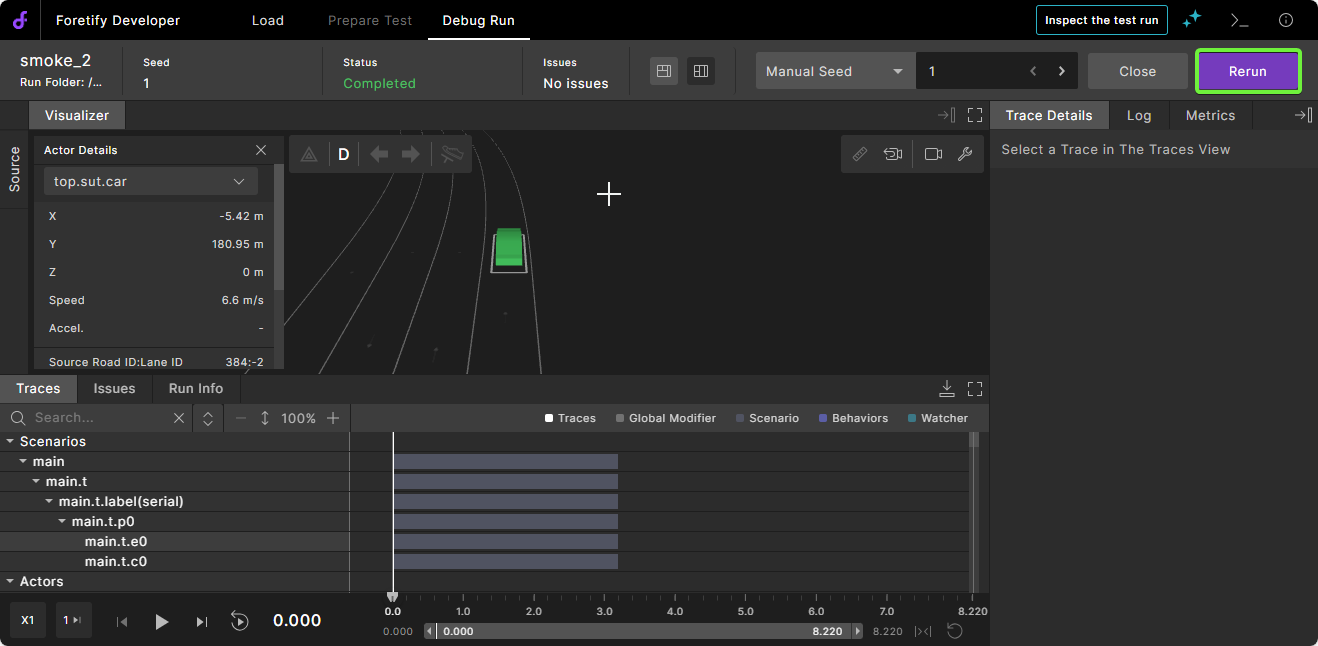
Foretify takes you to the Prepare Test tab so that you can configure the run if needed before re-executing it. For example, you can apply new traces or change the seed before rerunning.
Note
Although source data is stored in a folder under the
<workdir>/runs/sourcefolder, changing the files in this directory for the purpose of a rerun is not supported. See Viewing run data for details about run directories.
Use the Terminal
To execute a Foretify command:
-
Open the Terminal by clicking Terminal in the top right corner of Foretify Developer.
-
Type the command at the command line prompt in the Terminal.
Note
For a list of commands, see Foretify commands.
Use keyboard shortcuts
| Action | Current state | Shortcut | Comment |
|---|---|---|---|
| Open Terminal | not be focused on an existing target | t | |
| Close Terminal | esc | ||
| Toggle any frame to full screen | Debug Run or Prepare Test tab | Number keys 1, 2 or 3 | 1 is main frame, 2 is right frame, 3 is bottom frame |
| Leave full screen | Debug Run or Prepare Test tab | Number keys 1, 2 or 3 or esc | esc exits full screen, Number keys toggle |
| Trim beginning of timeline to playhead | T | [ | |
| Trim end of timeline to playhead | ] | ||
| Reset beginning of timeline to start of scenario | Ctrl + [ | Playhead stays where it is. | |
| Reset end of timeline to end of scenario | Ctrl + ] | Playhead stays where it is. | |
| Play | space | ||
| Pause | space | ||
| Forward 1 frame | Right arrow | ||
| Backward 1 frame | Left arrow | ||
| Forward 10 frames | Ctrl + Right arrow | ||
| Backward 10 frames | Ctrl + Left arrow | ||
| Change skip frame amount | f | Toggles between 1, 5, 10 and 20 | |
| Change playback speed | s | Toggles between x0.5, x1, x2 and x5 | |
| Jump time to start point of framed area | i | ||
| Jump time to start point of the timeline (This action should also unframe the timeline in case it is trimmed) | Ctrl + i |
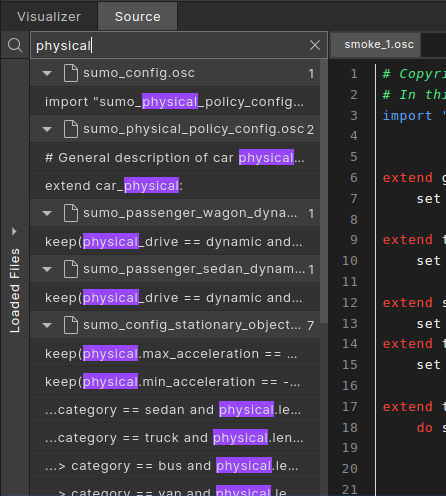
Search the code
To search the code:
- Open the Source tab.
-
Click the Search (magnifying glass) icon in the top left corner.
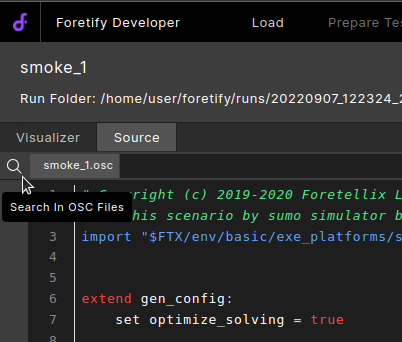
-
Type the search string in the Search field.
Foretify Developer displays the search results in the Search frame.
-
Click on a search result to navigate to the line in the source file where the search string was found.