105. Creating debug aid for matcher
During certain situations, the evaluation scenario fails to detect behaviors observed in the visualizer. Determining whether the behavior should have been matched and understanding why it was not detected, requires a tedious debugging process by R&D.
Similarly, for some cases it is challenging to understand incorrectly matched behaviors.
The Scenario Debugger is designed as a first-line tool to analyze matcher behavior. It aims to assist testers, application engineers (AEs), and R&D teams in narrowing down such issues.
105.1 Basic debug flow
105.1.1 Step 1: Looking for suspects
The debug flow begins with observing the matcher run in the visualizer (the runtime debugger) in either Foretify or Foretify Manager. The user may notice something suspicious as follows:
- Some situations that should have been detected
- A match that seems unwarranted
In either case, the user can capture the suspicious scenario along with the non-ego actor(s) involved.
105.1.2 Step 2: Running the matcher in debug mode
The user should re-run the matcher with two additional flags:
-
--debug_actor <actor recording id>Use the Recording ID (for example 1524446) for physical drive logs and the Foretify Actor ID (for example person@3417) for active tests. -
--debug_scenario <scenario instance name>Scenario name matching should be exact. Displaying evaluation results for multiple scenarios can make the interpretation very confusing.
With these flags, the matcher operates in debug mode and filters out all other scenarios and actors, focusing solely on the interaction in question. The matcher collects intervals for every modifier instance throughout the actor's lifetime. Note that modifiers are not typically represented as intervals.
105.1.3 Step 3: Analyzing debugger results
By observing the debug run results in the visualizer, it becomes much easier to understand the cause of a match or mismatch. This helps to debug a condition that is visibly present but was missed by a specific modifier, or a modifier that is active (returns true) when it shouldn’t have.
105.2 Example debug flow
The following match run has a few questionable matches. The debugger can offer insight into how the matcher is functioning.
Focusing first on ego_traverse_junction_with_crossing_vru, as shown below. A debug run of the matcher with the parameters --debug_actor 644810 --debug_scenario ego_traverse_junction_with_crossing_vru produced the results shown below.
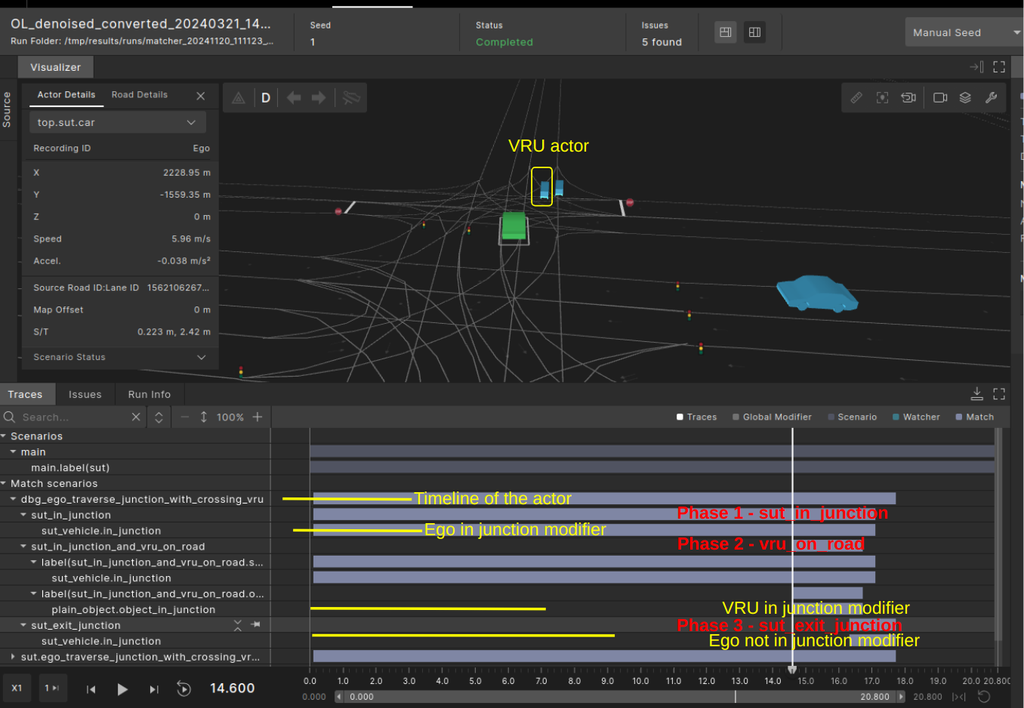
The match intervals in the debug run should be interpreted differently from normal match intervals. (In future releases, we may be able to visually differentiate them, such as by using different colors.)
- The top-level match interval represents the actor's timeline where scenario matching was attempted.
- The second-level intervals identify scenario phases.
- The third-level intervals represent actions, such as "drive".
- The bottom-level intervals represent modifiers, which are the important inputs that show where modifiers returned "true".
105.2.1 Debug chart view of the match
Understanding the interval chart in Foretify Developer can be challenging. The debugger generates an additional chart in a browser window, providing greater clarity.
The debug chart displays color-coded intervals for modifiers, actions, and operators. Hovering over an interval displays a pop-up with the following information:
- The exact start and end times.
- The hierarchical path for each interval, including both scenarios and modifiers.
- The invocation parameters for the specific modifier.
105.2.1.1 Interpreting the Debug Chart
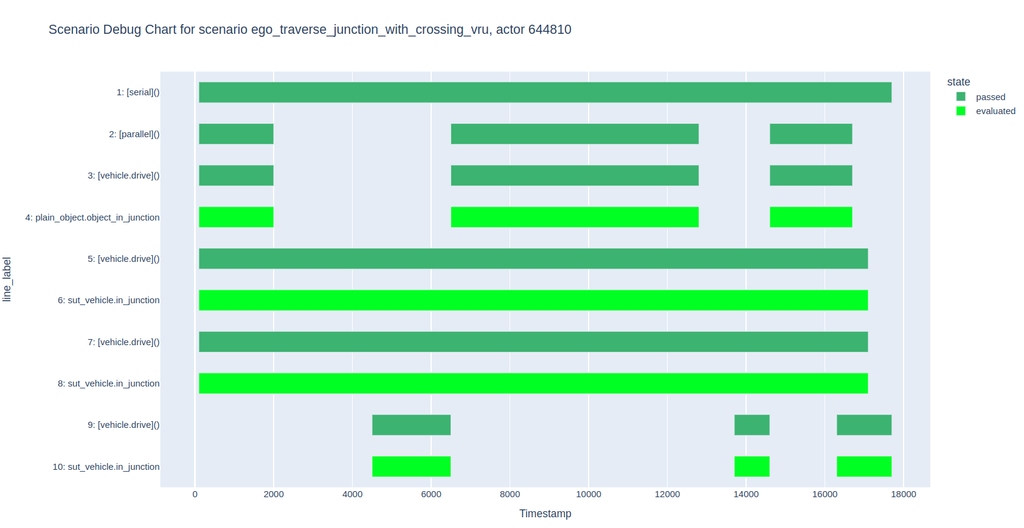
The bars in the chart represent scenarios and modifier invocations in the OSC scenario definition. Below is the interpretation of the chart for the scenario ego_traverse_junction_with_crossing_vru:
 do serial():
        sut_in_junction_and_vru_on_road: parallel(overlap: equal):
            object.act() with:
                object_in_junction(ref_car: sut.car, ref_car_max_distance_from_junction: sut_max_distance_from_junction)
            sut.car.drive() with:
                in_junction(start_offset: [min_offset_from_junction_start..])
        sut_in_junction: sut.car.drive() with:
            in_junction(start_offset: [min_offset_from_junction_start..])
        sut_exit_junction: sut.car.drive() with:
            in_junction(end_offset: [min_offset_from_junction_end..max_offset_from_junction_end])
The chart labels make it easy to associate the bars with specific scenario or modifier instances.
Chart color coding
- Green: Represents success. Scenario instances colored green are satisfied at the times marked.
- Light green: Reserved for modifier success.
- Red: Represents failure. Invocations marked red were never satisfied.
- Grey: Represents skipped. These were never evaluated because of a gating failure (so we never got to evaluate them).
The interval chart can help analyze the conditions that enabled a match at a specific time by showing which modifiers were satisfied. Modifier parameters can further clarify why a modifier was satisfied. Based on this information, the user can determine whether the match is justified or, alternatively, pinpoint the faulty modifier within a specific time interval and parameter setting.
Tracking false-negative cases (where a match was not detected but should have been), the chart can identify the modifier(s) responsible for denying the match. This analysis may lead to the conclusion that the absence of a match is valid or help focus on the modifier that incorrectly caused the denial.
105.2.1.2 Debugging a failed match
In the recording above, it may not be immediately clear why the lead_vehicle scenario is not detected between the Ego and the actor, as shown in the image below:
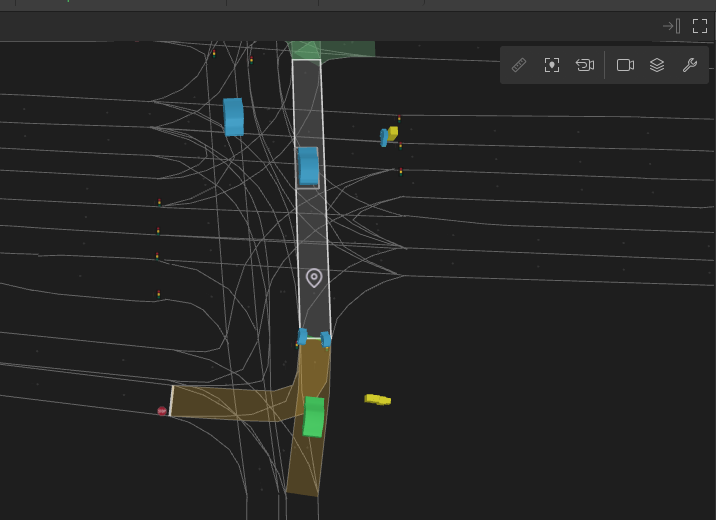
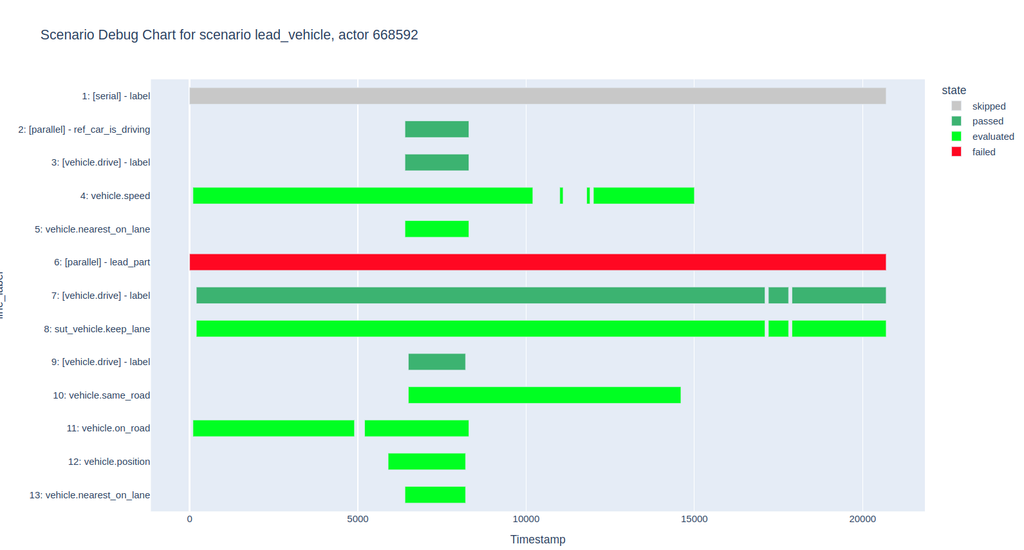
Running the matcher with the debug flags --debug_scenario lead_vehicle --debug_actor 668592 generates the following chart.
105.2.1.3 Interpreting the debug chart
- The failure of the
lead_partphase (line 6, highlighted in red) is clearly noticeable. - The failing phase is a parallel of two drives (lines 7 and 9), both passed because all their modifiers passed (the light green lines 8 and 10-13).
- Hovering over the failing phase reveals the
min_lead_part_phase_durationparameter. In this run, the parameter is set to 2 seconds, but the duration of the actor's drive (line 9) is only 1.7 seconds, causing the failure. - As a result, the top-level serial (line 1, grey) is skipped due to the failure of its child phase.
This drill-down identifies the root cause of the failed match and provides deeper insight into the matching logic.