55. Work with Triage views
Triage views let you categorize and browse the run data in different ways. A Triage view groups the data according to clusters. You can then view the runs that match a cluster path in a Runs table. The attribute columns shown per cluster are configurable.
55.1 View a triaged test suite result in a Triage view
When you access Triage initially, the triaged test suite result is displayed from the workspace.
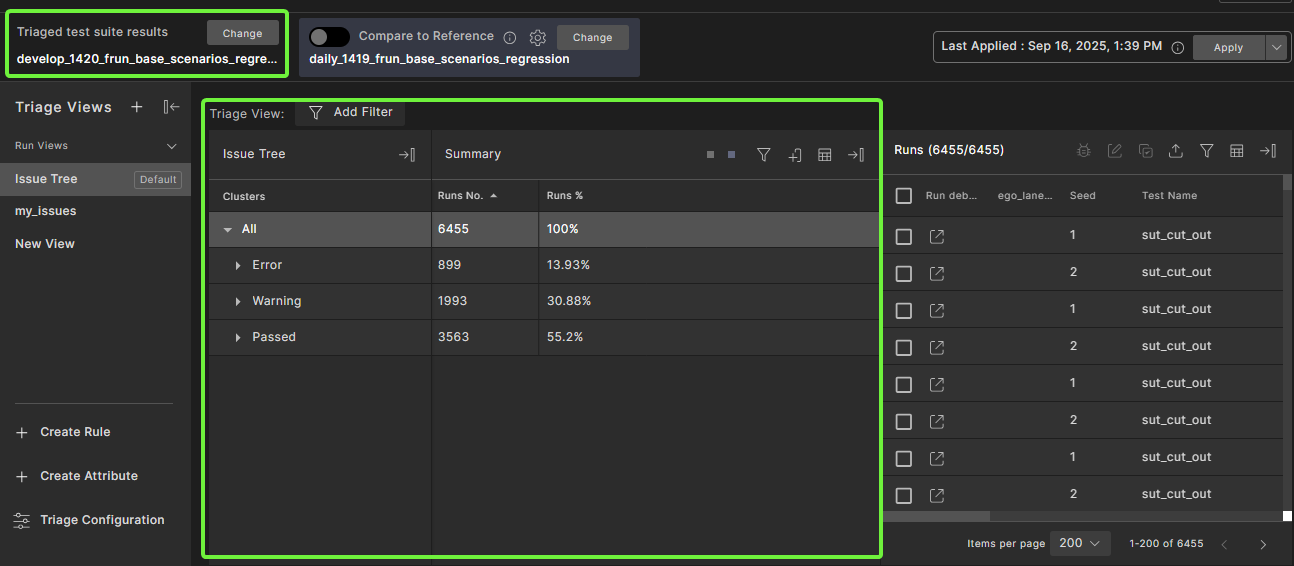
In the main Triage view, you can use the following components:
- The Triage Views pane lets you access the current views and create and access custom views.
- The Tree pane displays the test suite data in a tree structure.
- The Summary table displays statistical data associated with the clusters in the Tree pane.
- The Runs table displays all runs for the cluster selected in the Tree pane.
55.1.1 Change the triaged test suite result
To change the triaged test suite result:
-
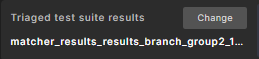
Click Change next to the Triaged test suite results.
-
Select a test suite result and click Apply.
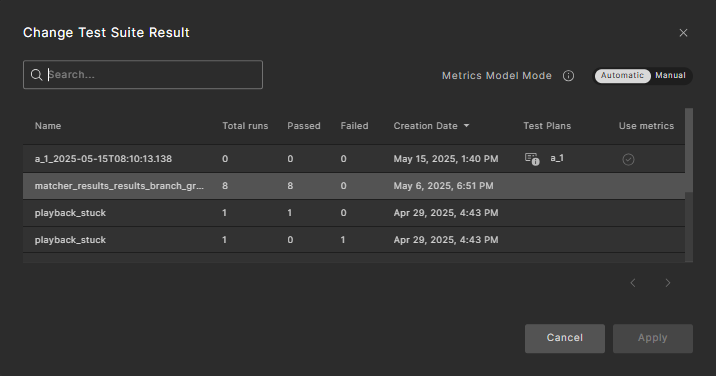
You can search for a specific test suite result if your list of results is long.
For more information on Metric Model Mode in Change Test Suite Result, see Control the metrics model used to calculate the coverage grade.
55.2 Triage Views pane
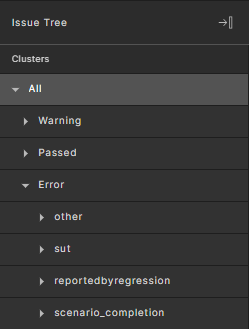
The Triage Views pane, located on the left, lists the available views. The Issues Tree view is organized by issue severity, cluster, kind, and normalized issue details.
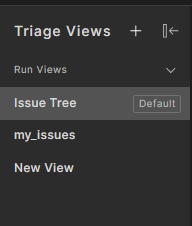
You can also create additional custom views.
55.3 Tree pane
The Tree pane, located to the right of the Triage Views pane, displays test suite results data in a tree structure clustered by attributes. It helps answer triage questions such as, "What are the most frequent SUT errors in a specific scenario?"
55.4 Summary table
The Summary table, located to the right of the Tree pane, displays statistical data for the Tree pane.
Initially, the Summary columns include:
- Runs count per cluster
- Runs count per cluster for the reference test suite result if one has been added
- Percentage of runs count from all runs
- Percentage of runs count from all runs for the reference test suite result if one has been added
If you have editor or owner permission for the workspace, you can add and rearrange Summary columns by clicking the Column Selection icon on the top right of the Summary table. See Select columns to display in a table for details.
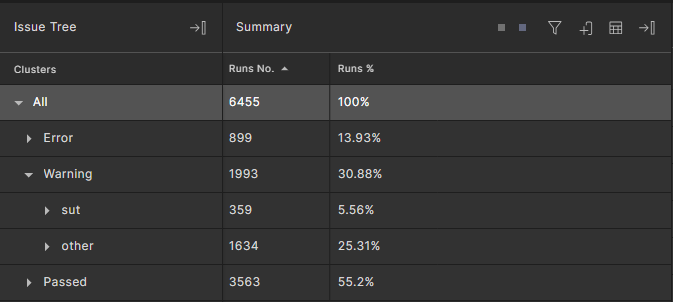
In the following Summary table of the triaged test suite result, notice that the number of runs and the runs percentage of a cluster are the sums of their sub-clusters.
55.4.1 Sort the Summary table
You can sort by column aggregates in the Summary table.
To sort the summary table:
-
Click a Summary table column header.
The rows are sorted in ascending order by the column you chose.
-
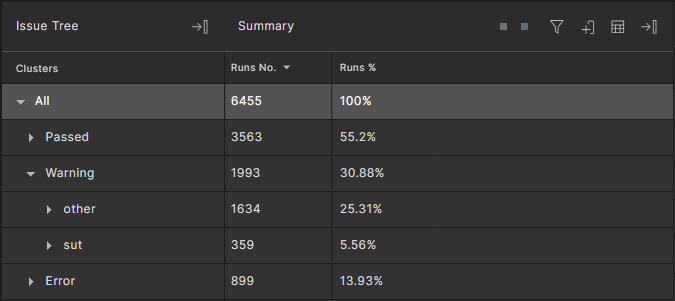
Click again to sort in descending order.
Note that since the Summary table shows clusters, each cluster is also sorted, as shown in this example:
55.4.2 Filter the Summary table by column aggregates
You can filter the Summary table by column aggregates.
To filter by column aggregates:
-
Click the Filter icon on the top right of the Summary table.
-
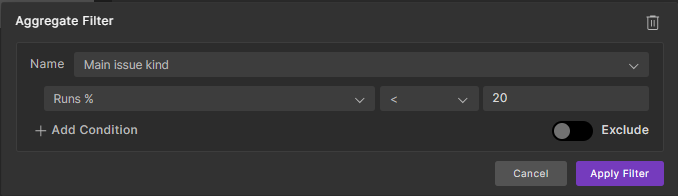
In the Aggregate Filter box, select a Tree Level.
Only a single tree level can be used for filtering by column aggregates.
-
Select the column aggregate for filtering.
-
Enter the filter condition.
Note that only numeric aggregates are supported. You can add more conditions within the same filter box or by adding an additional filter box by clicking the + to the right of the filter box.
-
Click Filter.
The Summary table is filtered by the condition entered.
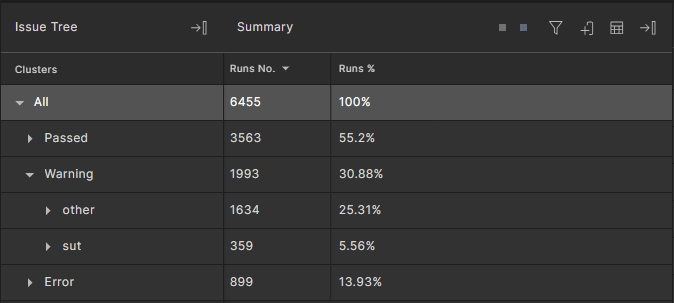
In the following example, the filter shows only scenarios with a "Runs %" aggregation that is below 20%:
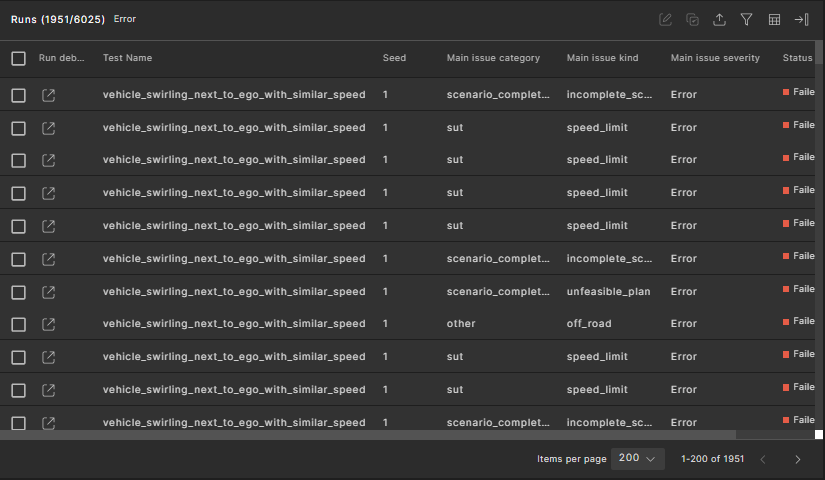
55.5 Runs table
The Runs table displays all runs for a selected cluster in the Tree pane. At the top, the Runs table displays the number of runs in this cluster and the name of the cluster. In this example, the cluster is All so no cluster displays. The Runs table displays attribute columns defined by the view.
You can access the following commands from the top-right of the Runs table:
| Icon | Name | Description |
|---|---|---|
| Set Attribute | Select runs and click the Set Attribute icon to set a triage attribute for the selected run(s). | |
| Copy To Clipboard | Select runs and click the Copy to Clipboard icon to save an encoded query object that includes the run IDs, workspace ID, and view ID. Python SDK can then use the object to query for the details of the runs. See Copy Triage context for details. | |
| Export selected to | Select runs, click the Export selected to icon, then choose Table Format or FRun Format. If you don't select particular runs, you can export the entire runs table for the cluster. See Export to Table or FRun format for details. | |
| Filter | Click the Filter icon to further filter the Runs table. See how to create a triage filter. This filtering is local and is not saved for the view. | |
| Column Selection | Click the Column Selection icon to add or remove attributes from the view, or to rearrange the view. See Select columns to display in a table for details. |
55.5.1 Open the debugger from the Runs table
You can open a run in Visualizer to investigate issues.
To open a run in the debugger:
-
In the Runs table, locate the run you want to investigate.
-
Click the Open Triaged Run in New Tab icon in the Run Debugger column to launch the run in the Debug Run tab.
The run launches in Visualizer in the Debug Run tab. The Debug Run tab is the same as the Debug Run tab in Foretify Developer. For details, see Debugging a run. Note that you can also download the folder for a run on the Debug Run tab so that you can re-execute the run.
If you have a reference test suite result, you can click the Open Previous Run in New Tab icon to the right of the Open Triaged Run in New Tab icon to compare the runs.
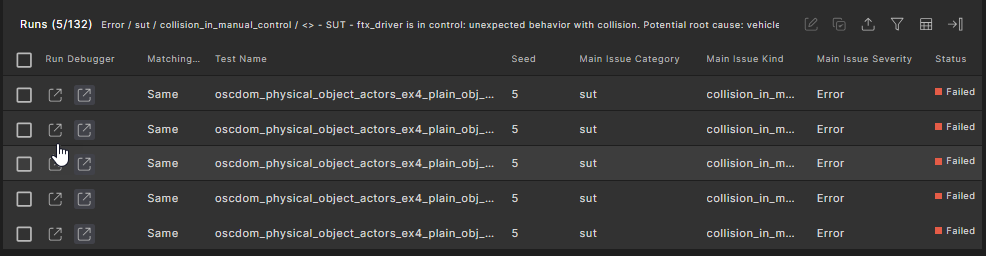
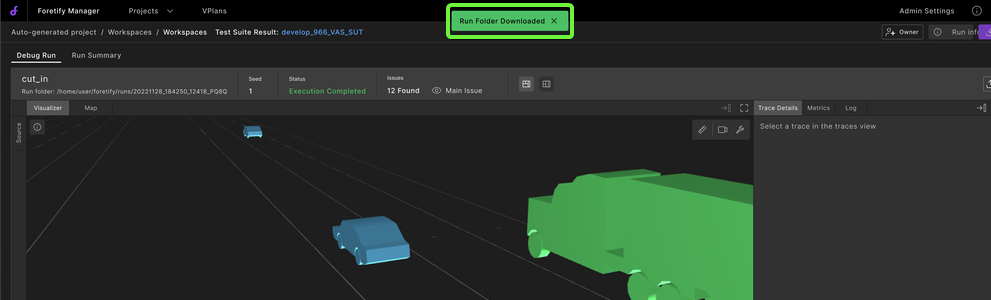
Navigating back to the project, workspace, or test suite result
When opening the single-run debugger from the workspace's Runs Table, Intervals Table, or Triage Table, you can easily navigate back to the project, workspace, or test suite result by clicking on the links shown above the single-run debugger.
The title for the link is constructed as <Project>/<Workspace>/<Test Suite Results>:

55.5.2 Create a triage filter
You can filter runs in the Runs table and in Triage views, Triage rules, and Aggregates. You can apply filters based on standard or user-defined run attributes, as well as create filters on metric items. The following procedure shows how to create a filter from the Runs table. Refer to the following sections to create filters when you create a custom view, create a triage rule, or create an aggregate.
To create a triage filter:
Note
If you create a filter from the Runs table, the filtering is local and is not saved for the view.
-
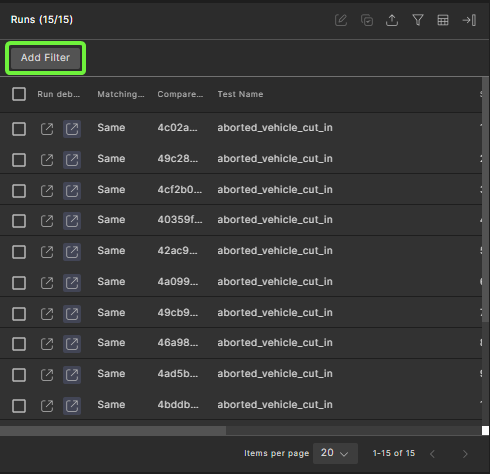
To create a filter for the Runs table, click the Filter icon on the top right.
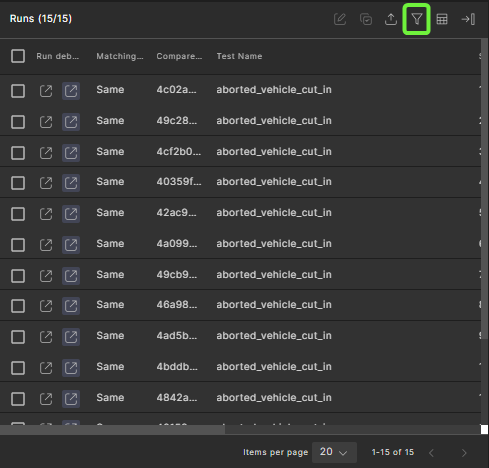
The Add Filter button is displayed.
-
Click Add Filter, then select the required filter type.
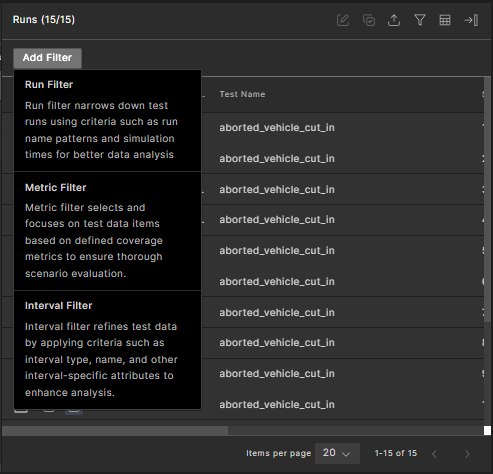
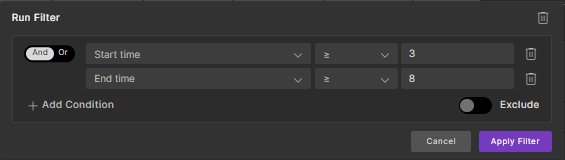
To create a run filter:
a. Select Run Filter.
b. Define the filter conditions.
c. To add more conditions, click + Add Condition, choose And or Or, and specify the additional conditions.
d. Select the Exclude radio button to exclude runs that match the defined filter conditions.
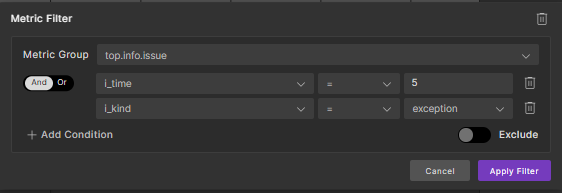
To create a metric filter:
a. Select Metric Filter.
b. Define the filter conditions.
c. To add more conditions, click + Add Condition, choose And or Or, and specify the additional conditions.
d. Select the Exclude radio button to exclude metric items that match the defined filter conditions.
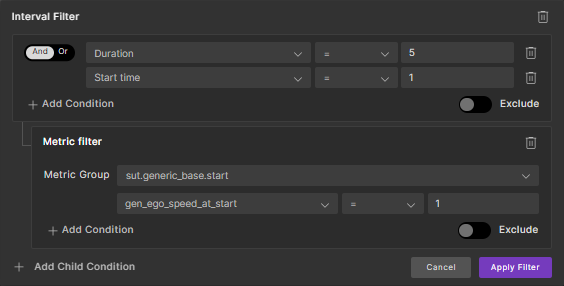
To create an interval filter:
a. Select Interval Filter.
b. Define the filter conditions. For more information, see Metric item operators below.
c. To add more conditions, click + Add Condition, choose And or Or, and specify the additional conditions.
d. To add child conditions, click + Add Child Condition, and select Metric Coverage or Watcher Interval.
e. Select the Exclude radio button to exclude intervals that match the defined filter conditions.
Note
You can delete filter components using the Remove filter (trash can) icon.
-
Click Apply Filter.
Metric item operators
Metric items can be used in filters. For every metric type, different operators are supported, as shown in the following table:
| Type | Equals | Bucket name equals | Matches | Doesn't match | Less than | Less than or equal to | Greater than | Greater than or equal to |
|---|---|---|---|---|---|---|---|---|
| enum, bool | yes | yes | no | no | no | no | no | no |
| string, cross-coverage | yes | yes | yes | yes | no | no | no | no |
| float, uint, int or unknown | yes | no | no | no | yes | yes | yes | yes |
Note
The Equals operator requires an exact match. The Matches operator takes a regular expression.
55.5.3 Download a run folder
To download the folder for a single run:
In the Debug Run window, click the Download Run Folder button at the top left of the window.
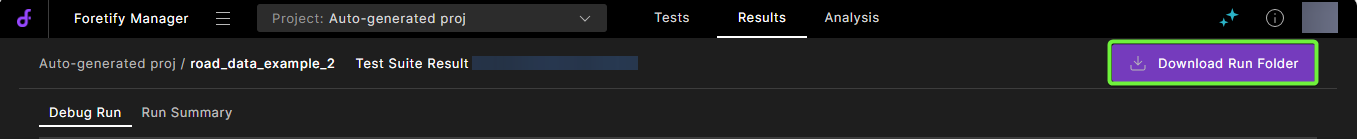
Result: A Downloading run folder pop-up message is displayed.
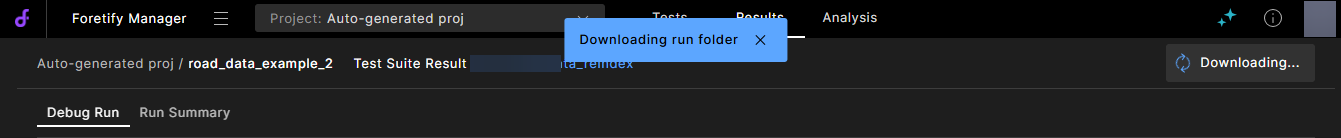
The run folder is downloaded as a .zip file to your Downloads folder. After the download completes, a Run Folder Downloaded pop-up message is displayed.
Note
It might take a few seconds to prepare the ZIP file. During this time, a progress bar is displayed, and additional downloads are disabled. The download button is re-enabled when the download is complete.
55.6 Triage configuration
To manage triage resources such as rules, views, attributes and aggregates, click Triage Configuration on the bottom left of the Triage view.

Note
Triage configuration is only available if you have editor or owner permission for the workspace.
The Triage Configuration page displays.
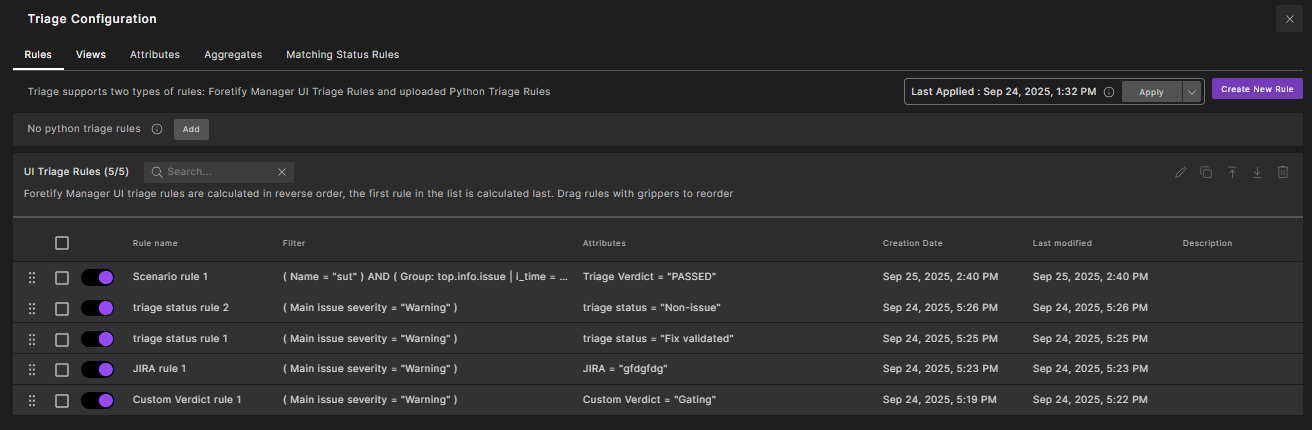
In the Triage Configuration page, you can perform search action using the search box. The search is performed on resource names (such as, view, rule, attribute, and aggregate).
Use this view to configure: