8. Evaluate Clip
You view the ingested run actors and trajectories in the Visualizer pane.
The Visualizer, Traces, and other panes in the Single Run Debugger can each be resized, expanded, or collapsed to tailor the layout to your current task. Your preference is saved and persists.
8.1 Visualizer display size and view preferences
The Visualizer, Traces, and other panes can each be resized, expanded, or collapsed to tailor the layout to your current task. Your preference is saved and persists.
8.1.1 Adjust individual panes
- Click the Maximize
 icon for the pane to occupy maximum available screen space. Click the
  icon to restore it to the previous arrangement.
 - Use the Expand
 and Minimize
  icons to show or hide individual panes.
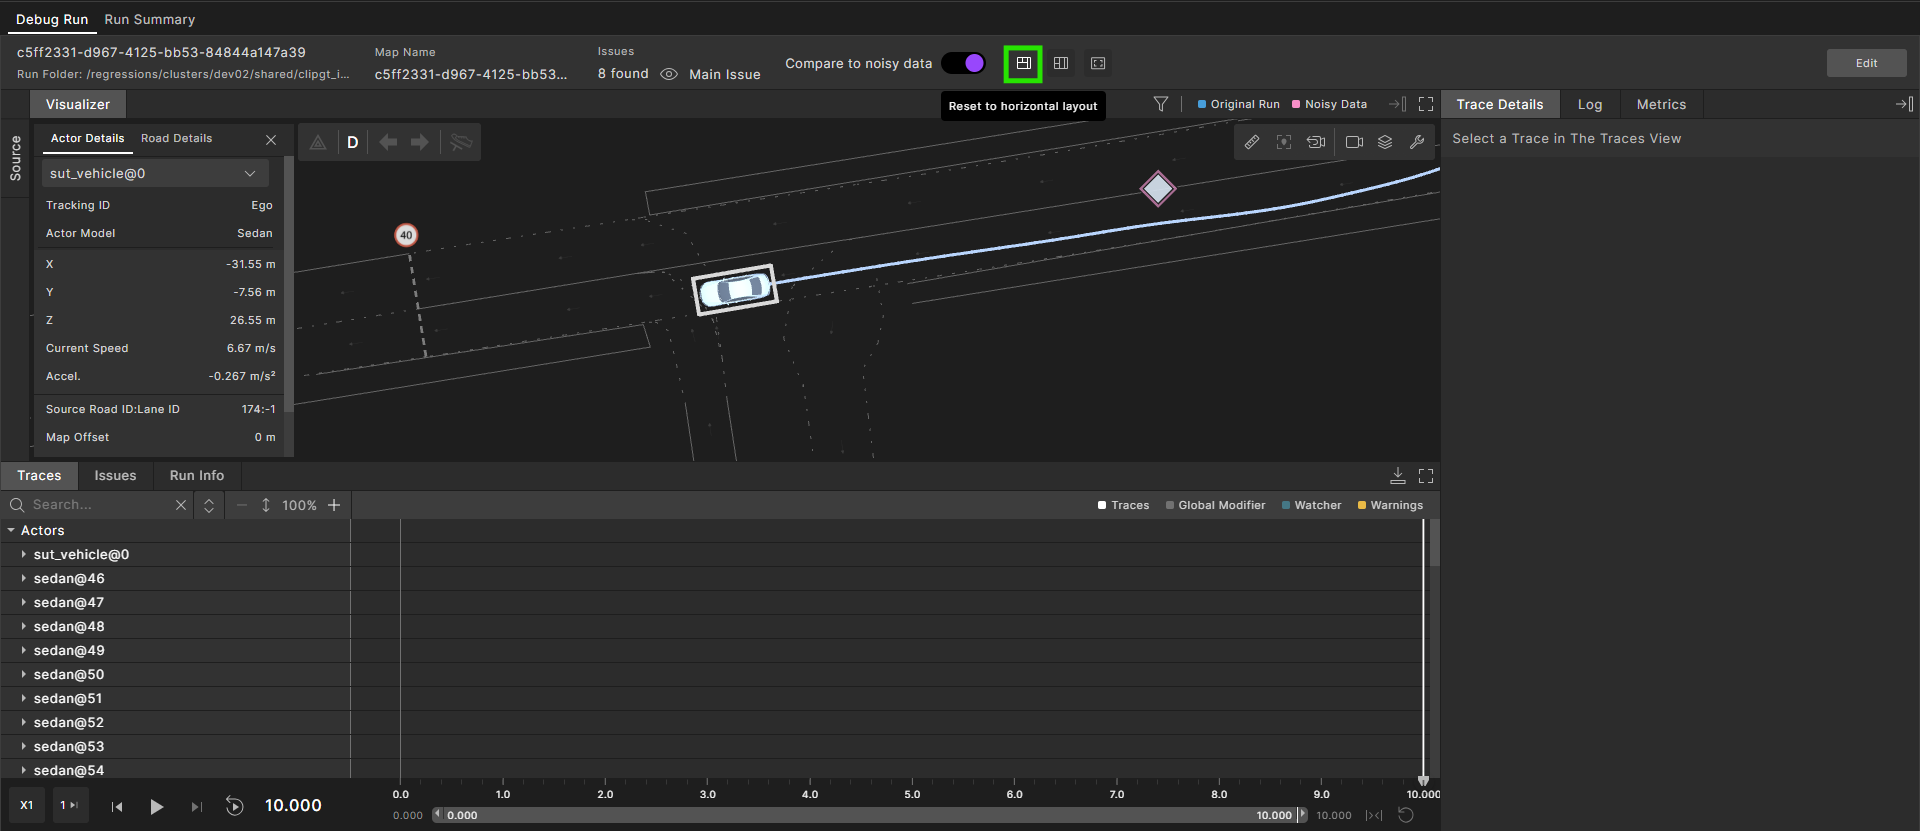
8.1.2 Layout presets
Three preconfigured Visualizer Layout Views ![]() are available with layouts suitable for the most frequent tasks. Selecting a layout preset returns you to its predefined arrangement instantly.
are available with layouts suitable for the most frequent tasks. Selecting a layout preset returns you to its predefined arrangement instantly.
-
Horizontal layout

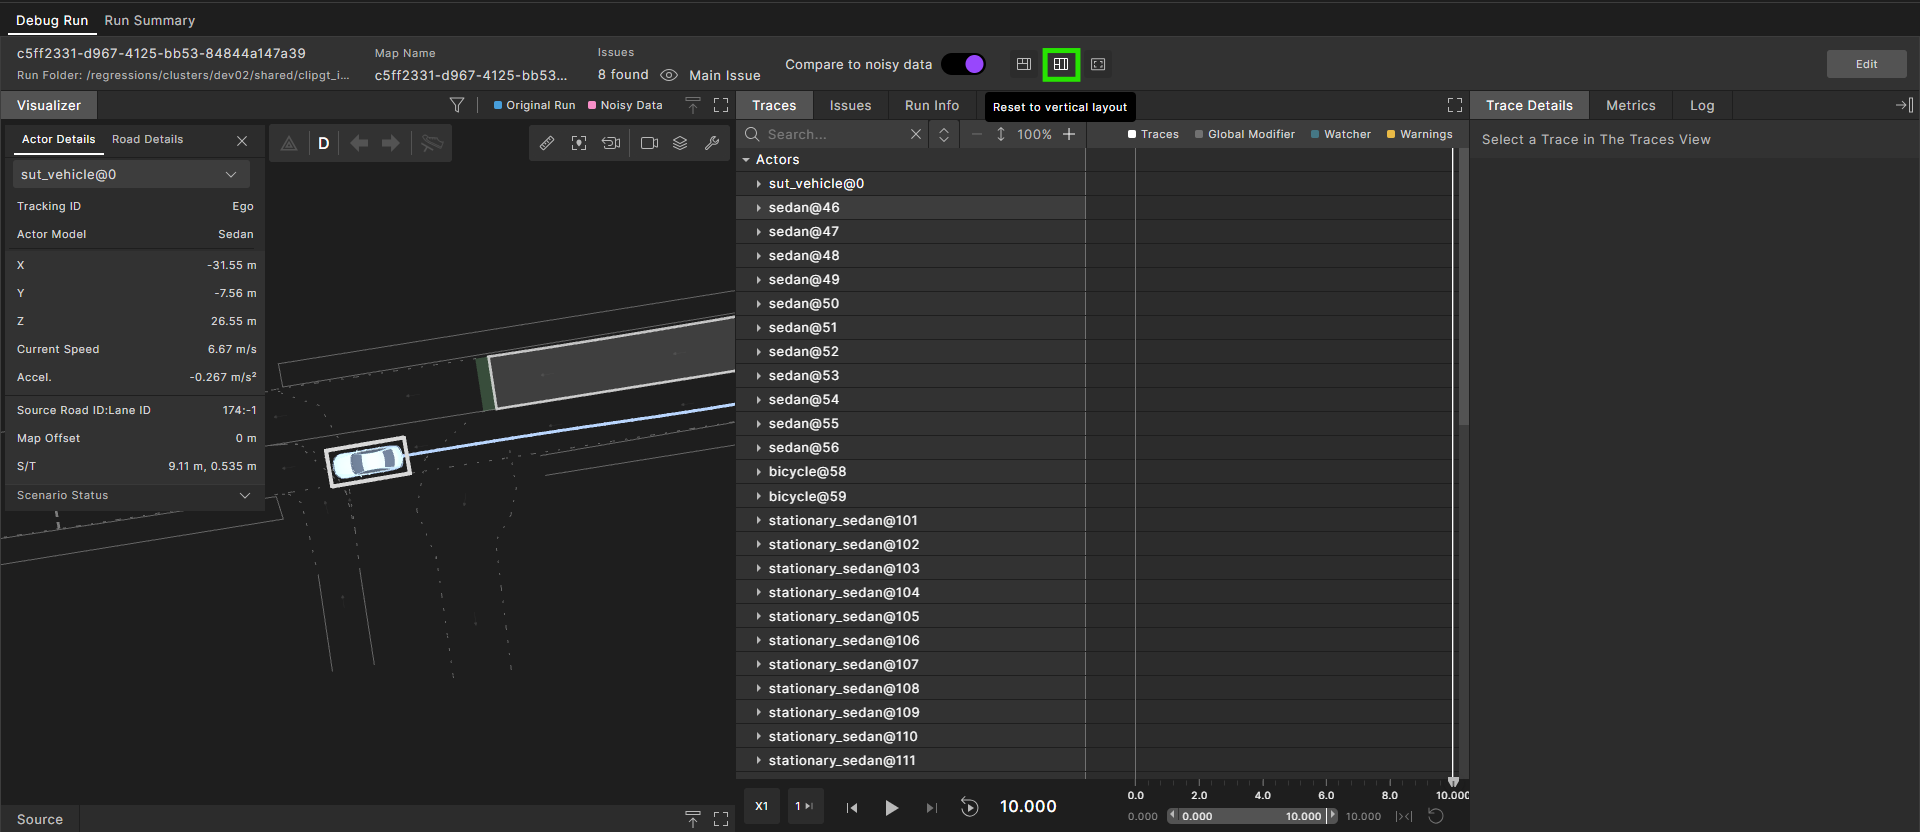
-
Vertical layout

-
Visualizer-focused layout

Maximizes the Visualizer and tucks the other panes out of view. Expand any pane on demand when you need it.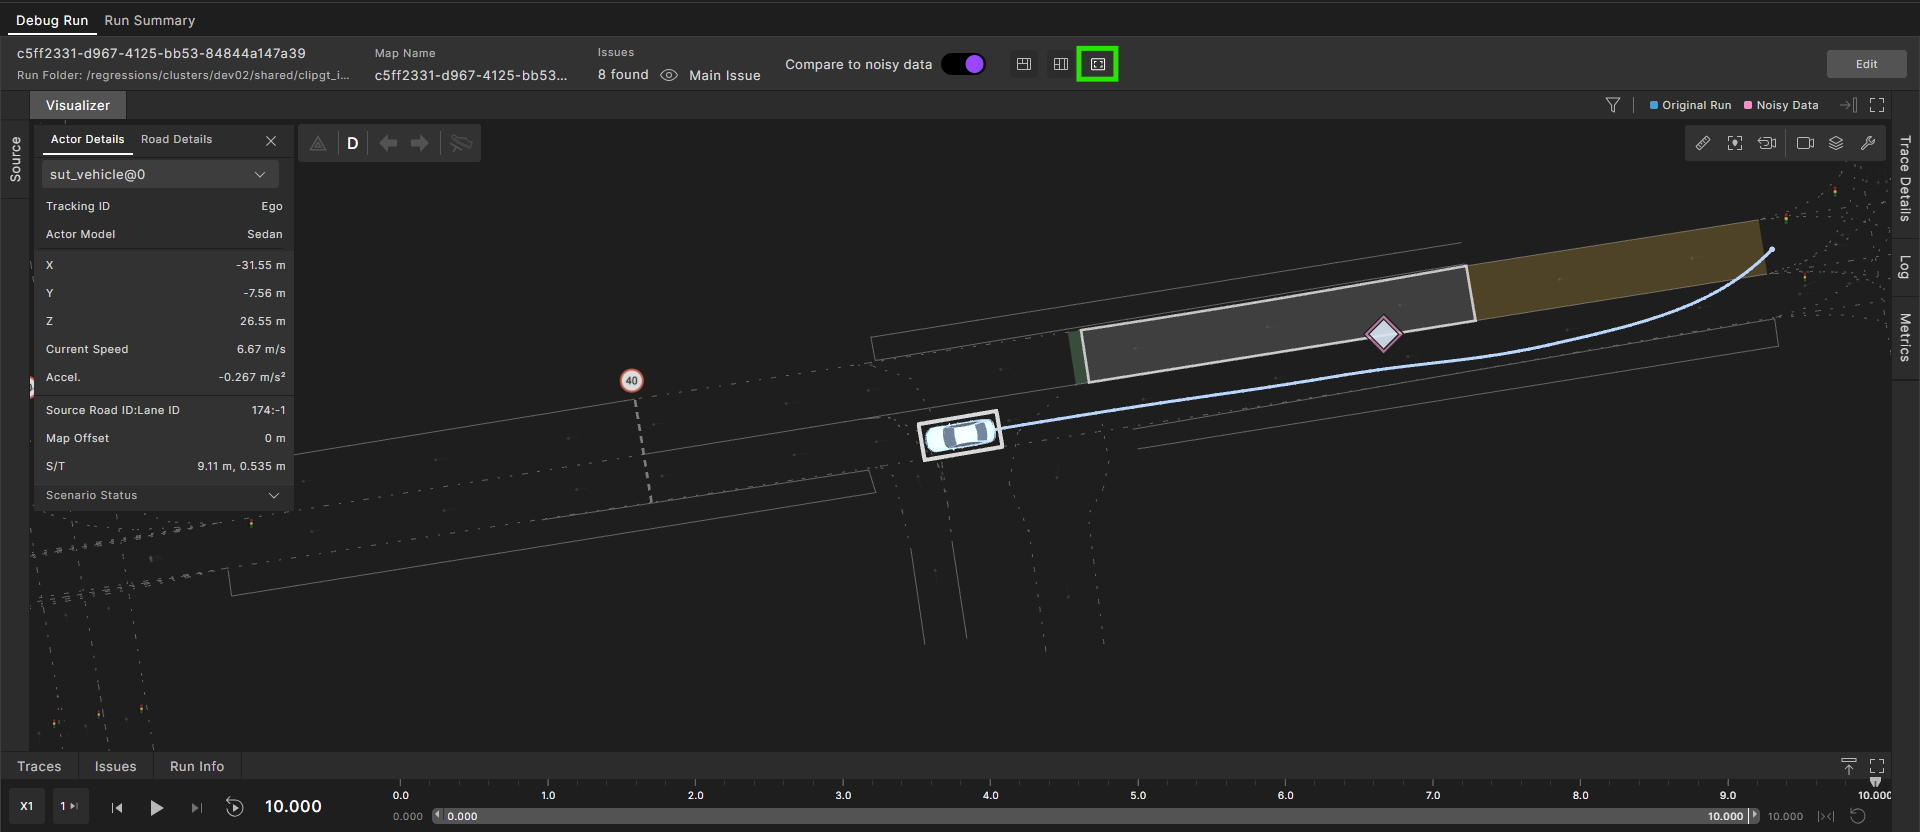
8.2 Viewing the ingested scenario
-
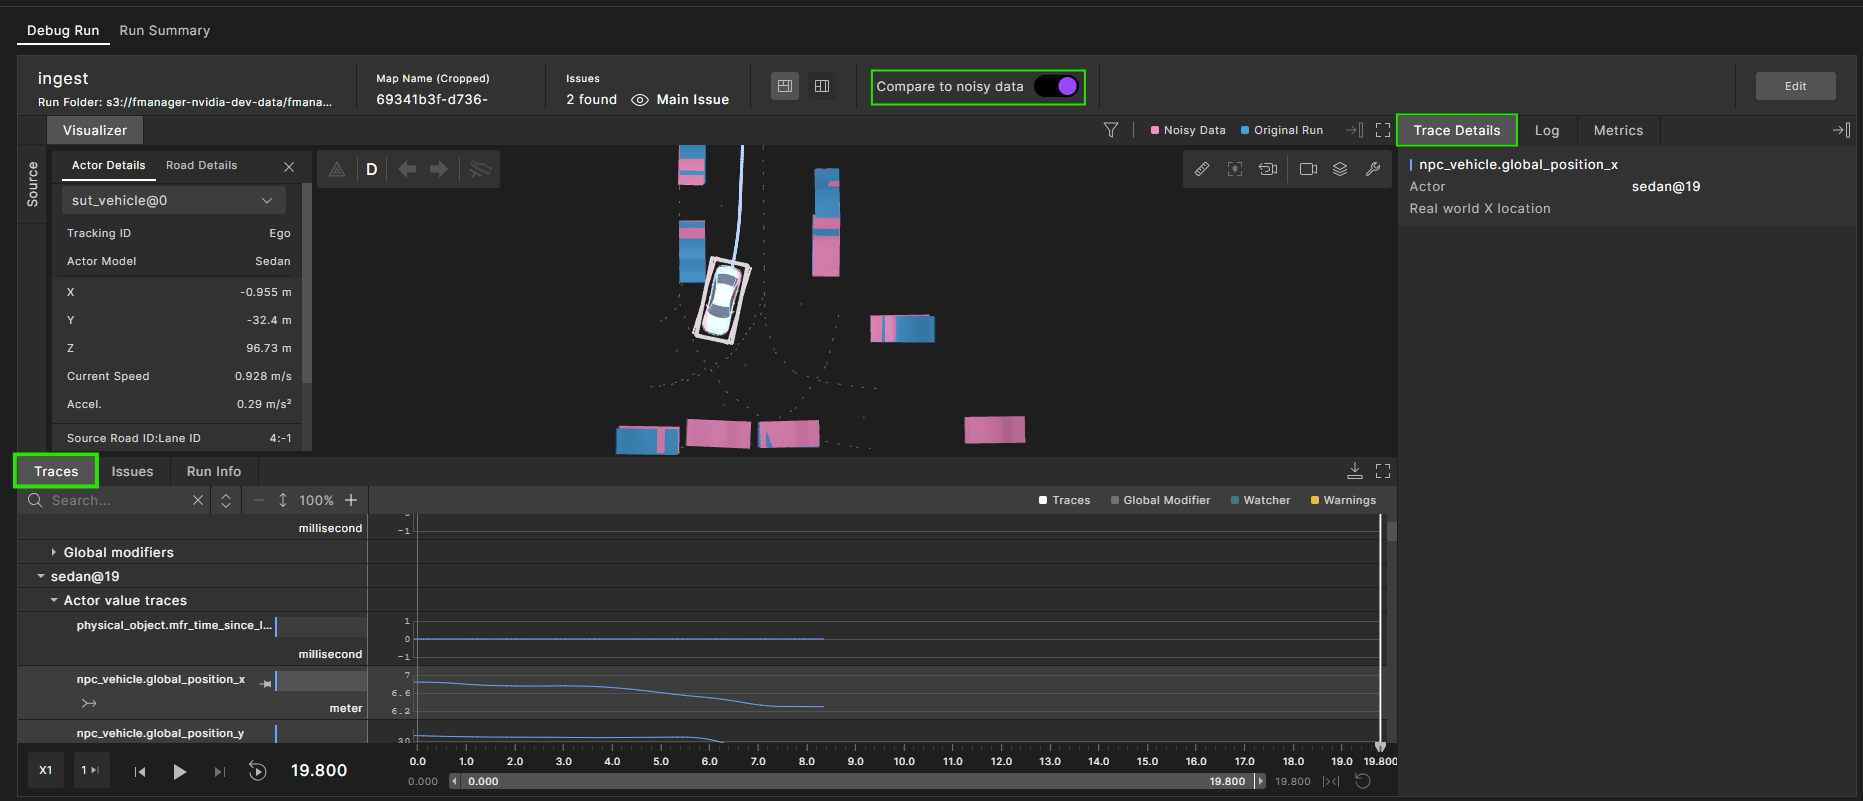
Enable the Compare to noisy data toggle to show both the original Imported Clip (noisy) and the Ingested Clip (denoised); use the toggle to turn each on and off for side‑by‑side inspection.
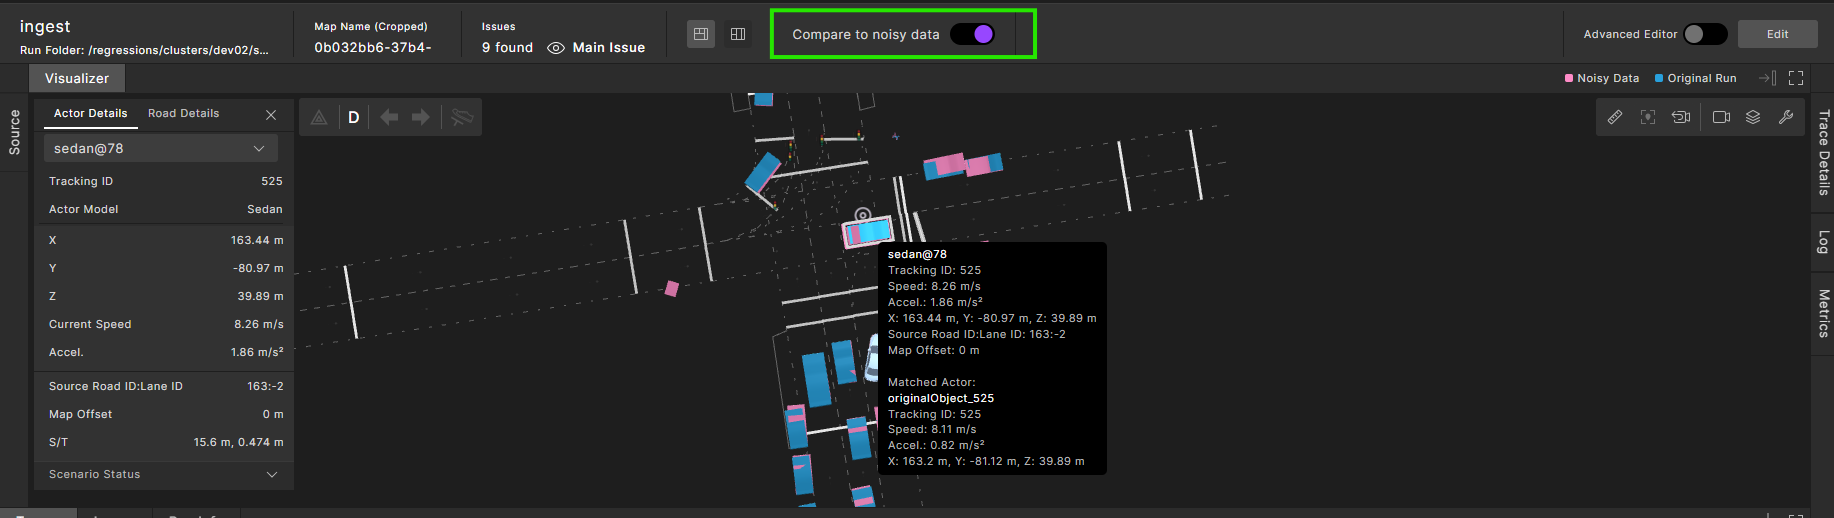
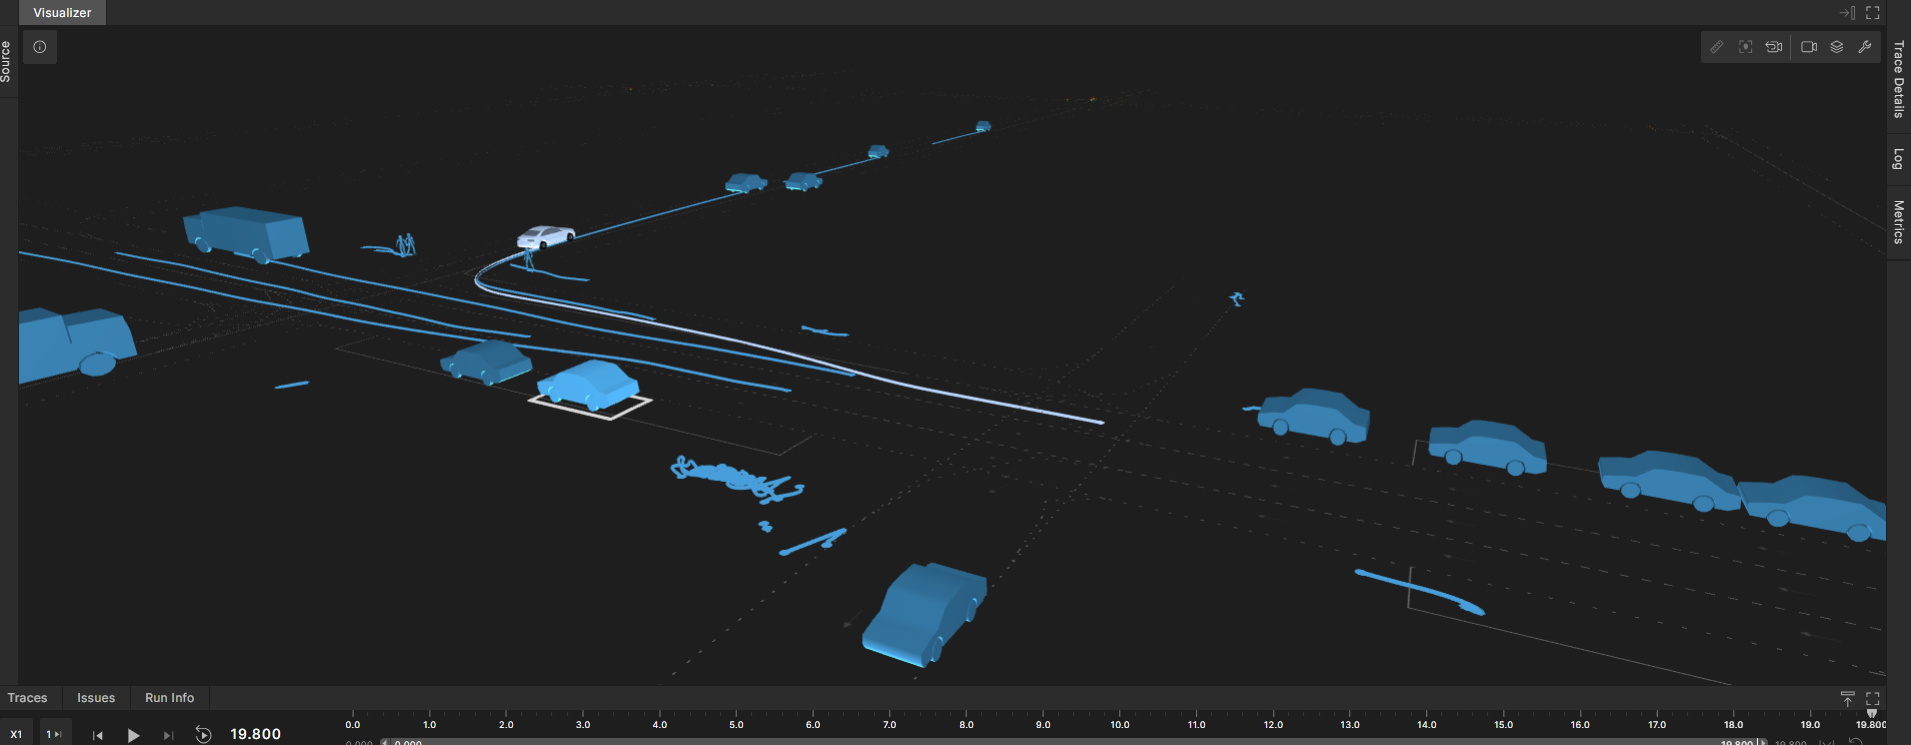
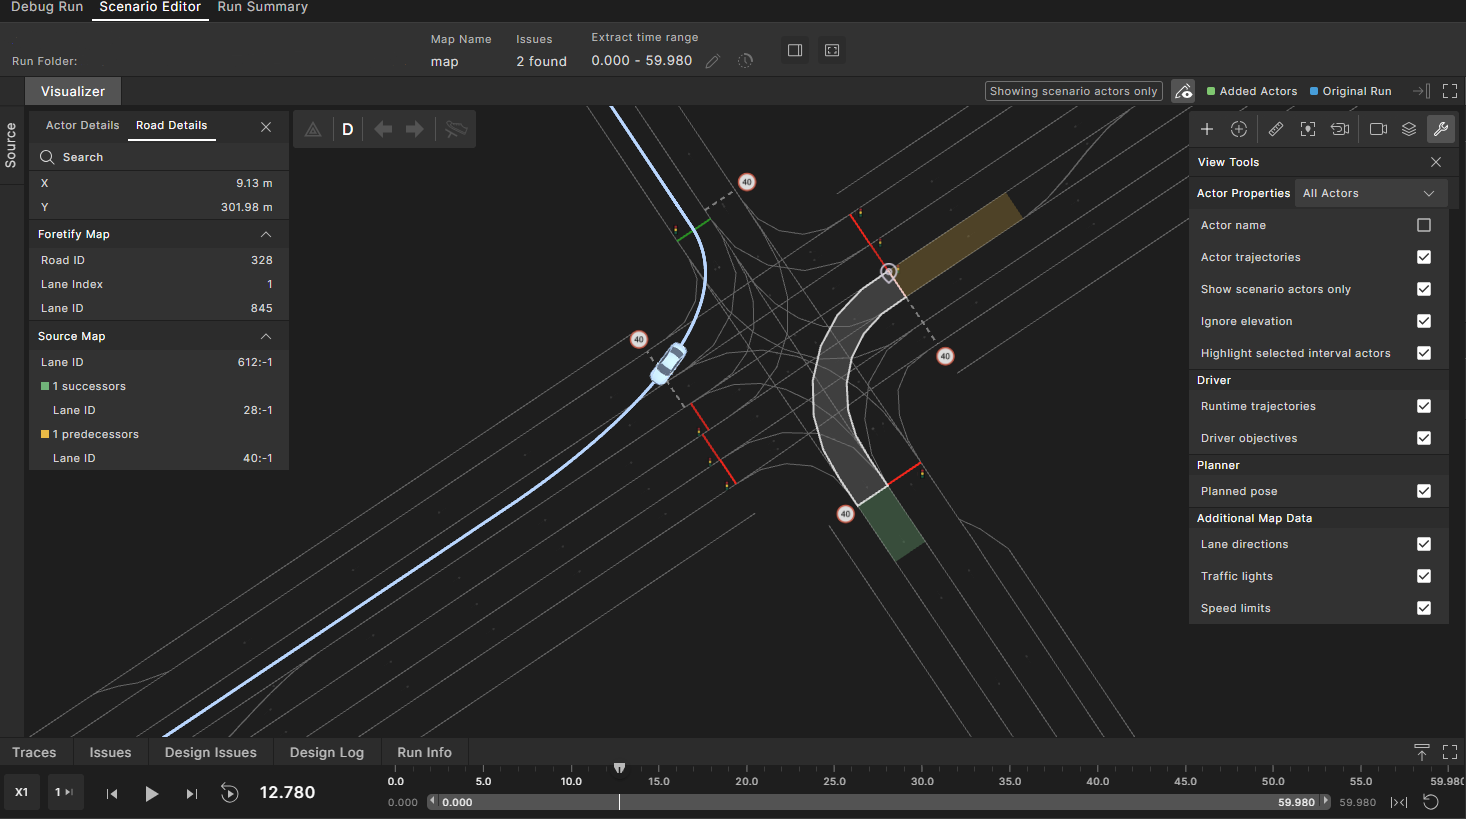
To ensure more realistic and complete scenarios, stationary vehicle extrapolation automatically extends detected stationary vehicles (primarily parked cars) across the full duration of the clip. The denoiser preserves their last known position and assumes zero velocity to maintain temporal consistency throughout the scenario.
The image below illustrates the Foretify Manager view, where a parked vehicle has been automatically extrapolated over the entire clip duration by the denoiser.
-
Click the View Tools
 icon.
icon. -
To view actors and trajectories to analyze movement patterns, in the Actor Properties dropdown menu:
- Select Selected Actor to view a single trajectory.
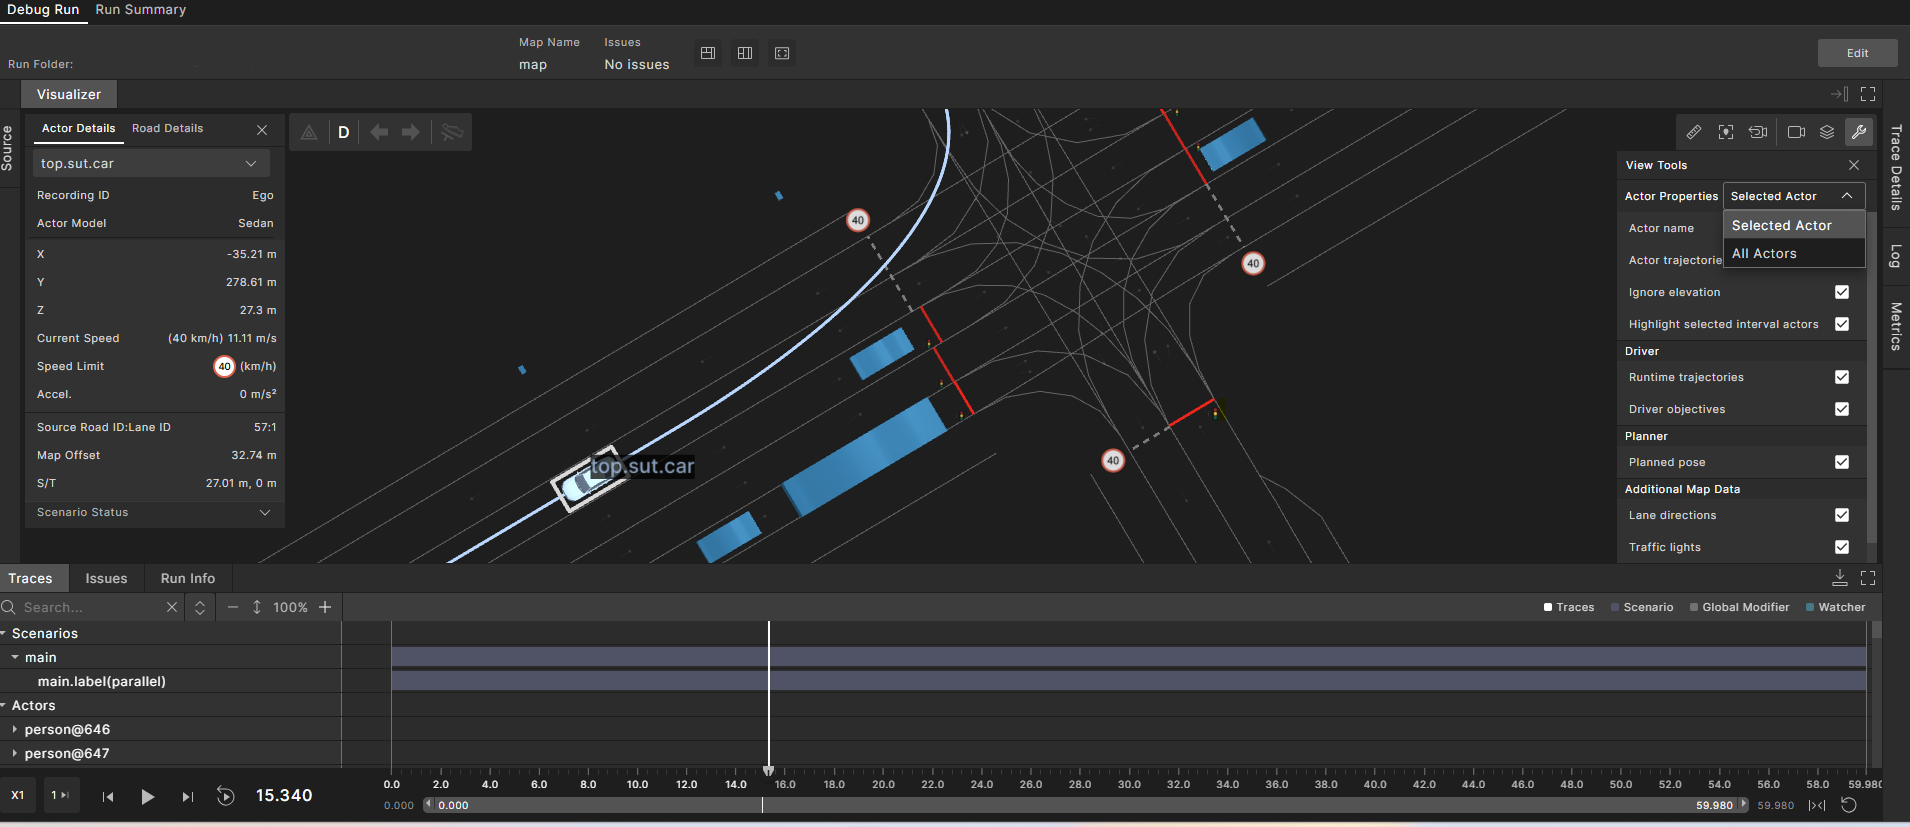
- Select All Actors to view all actors' trajectories.
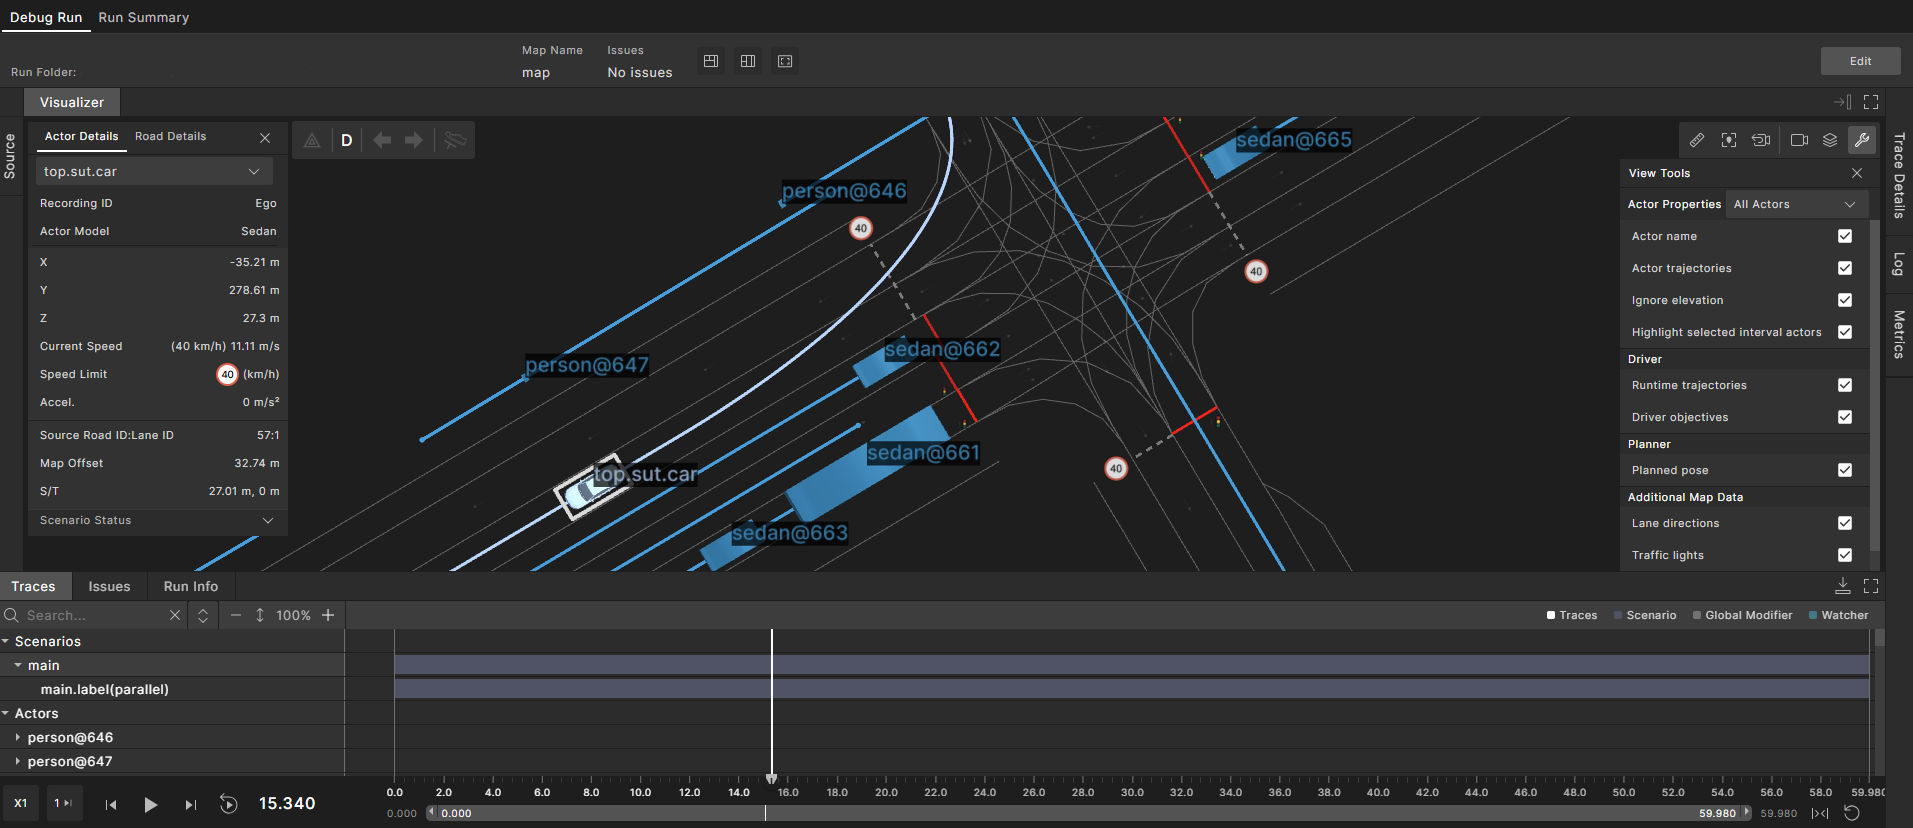
-
Check or uncheck options from the available View Tools options to customize what appears in the display:
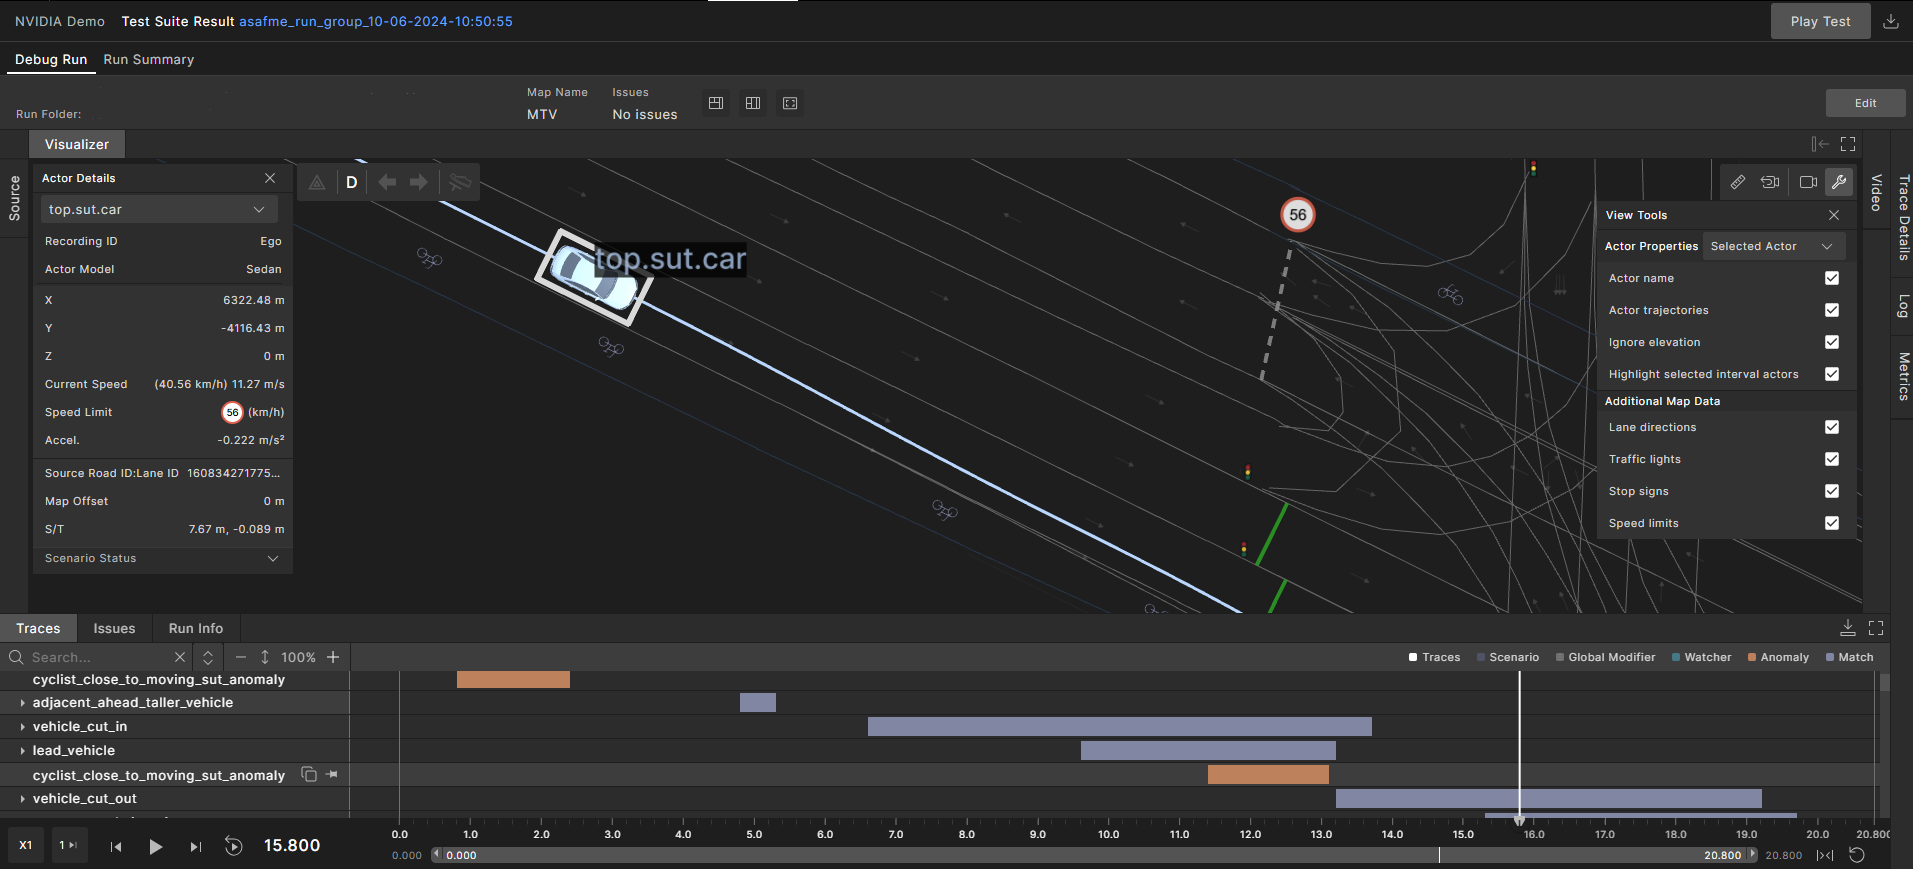
To help you focus on the map data relevant to your scenario without cluttering the map, five options are available under Additional Map Data, making it easier to interpret vehicle behavior and analyze runs in context of the map elements.
-
Lane direction: Displays lane direction indicators so you can see the permitted travel directions for each lane.
-
Traffic lights: Displays the location of traffic lights and their corresponding dynamic, colored traffic light-state lines, if present in the current run. The line colors change according to the current traffic light state to indicate whether vehicles are expected to stop (red) or can proceed (green line).
-
Stop signs: Displays the location of stop signs and their corresponding stop lines, if present in the current run.
-
Yield signs: Displays the location of yield signs, if present in the current run, to indicate where vehicles should slow down and yield for oncoming traffic before proceeding.
-
Speed limit: Displays speed limit signs, if present in the current run, to help evaluate compliance and driving context.
-
-
When you click Edit to open the scenario editor, you can select to view scenario actors only.
8.3 Viewing Traces of compared actors
Use the Traces panel to visually compare the behavior of actors in noisy (raw) and denoised (processed) data.
-
Enable comparison mode:
- In the Visualizer, toggle Compare to noisy data to display both the original (noisy) and denoised actor trajectories.
- Noisy data is typically shown in pink, while denoised data is shown in blue.
-
Select the actor of interest:
- Use the actor selection bar in the Traces panel to choose the actor you want to analyze.
- Actor IDs are mapped between noisy and denoised versions, allowing direct comparison.
-
View and analyze the traces:
-
The Traces panel displays synchronized time-series plots for key parameters:
- Speed
- Acceleration
- Distance
- Position
- Orientation
-
These traces show both the noisy and denoised values for the selected actor, making it easy to spot differences and assess the effectiveness of the denoising process.
-
-
You can choose to display traces for all actors or focus on a single actor. This is useful for understanding scene-wide effects or isolating specific issues.