62. Work with summary column aggregates
Creating aggregations on top of run data is one of the most effective tools for analyzing the data. By default, Foretify Manager comes with a set of default aggregations, such as Runs, Runs %, and pass-rate aggregations (Failed SUT, Failed Others, Passed). These aggregations are available for the triaged and reference test suite results. You can create additional aggregates to further analyze the run data.
Note
You need editor or owner permission of the workspace you're in to create an aggregate. Aggregates are created at the system level. Once you create an aggregate, any other users of the system can use it.
62.1 Manage summary column aggregates
To manage aggregates:
-
Click Triage Configuration at the bottom left of the Triage view.

The Triage Configuration page displays.
-
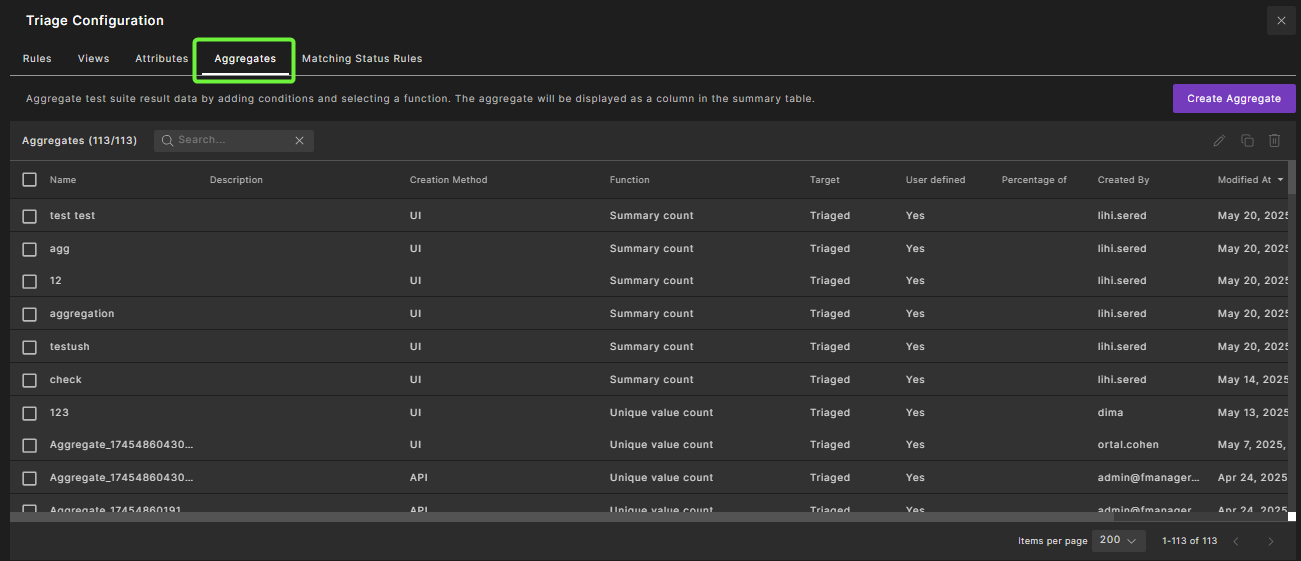
Select the Aggregates tab.
A table with all available aggregates displays:
-
On the Aggregates tab, you can do the following:
-
To create a new aggregate, click Create Aggregate on the top right. See Create a summary column aggregate for steps.
-
To edit an aggregate, select the aggregate and click the Edit icon on the top right. Edit the aggregate settings and click Save.
-
To delete an aggregate, select the aggregate and click the Delete (trash can) icon on the top right. To confirm, type Yes and click Delete.
-
62.2 Aggregates table
The Aggregates tab provides a table with all available aggregates. Following are the columns of the Aggregates table:
| Column | Description |
|---|---|
| Name | The name of the aggregate. |
| Description | A detailed description of the aggregate. |
| Function | The aggregation function name. |
| Percentage Of | For percentage functions, defines the percentage denominator (all/category). |
| User Defined | Specifies whether the aggregate was defined by a user (Yes/No). |
| Created By | The name of the user who created the aggregate. |
| Modified At | The date and time when the aggregate was last modified. |
62.3 Create a summary column aggregate
Note
You need editor or owner permission of the workspace you're in to create an aggregate. Aggregates are created at the system level. Once you create an aggregate, any other users of the system can use it.
To create an aggregate:
-
Create an aggregate using one of the following methods:
-
Click Triage Configuration on the bottom left of the main Triage view, then select the Aggregates tab and click Create Aggregate on the top right.
-
On the Summary table, select the Create Aggregate icon on the top right:
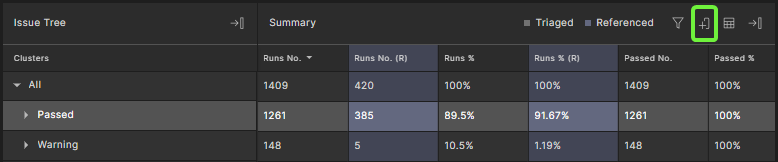
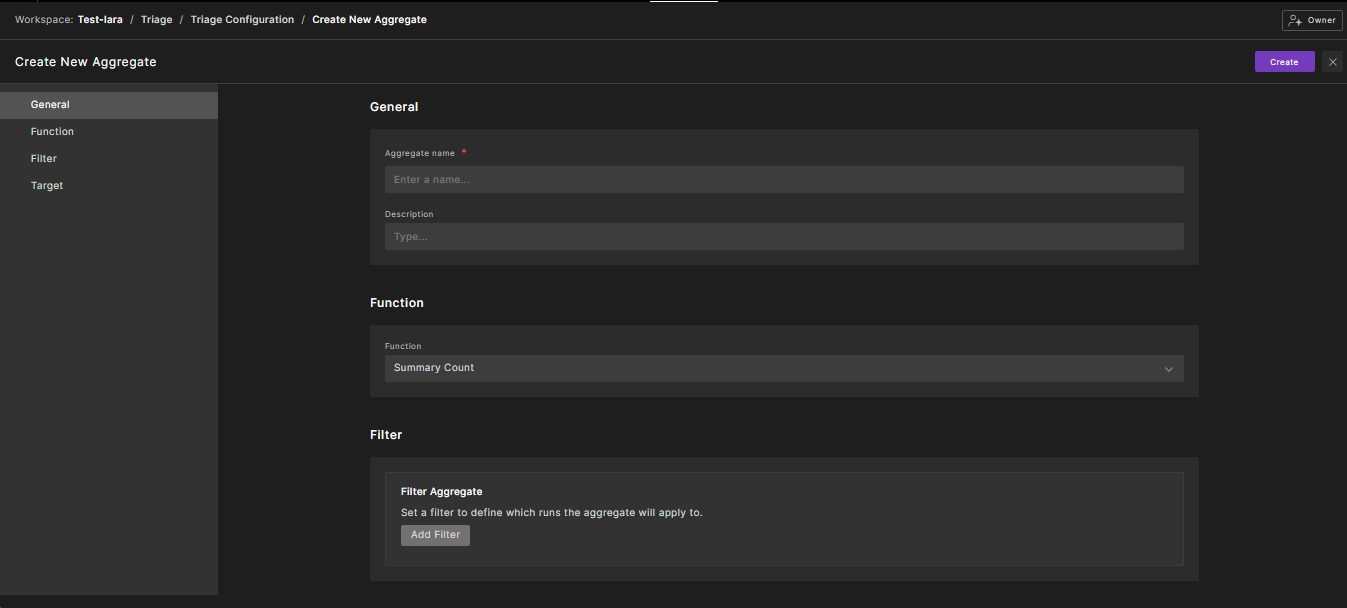
The Create Aggregate box displays:
-
-
Enter a unique Name for the aggregate.
-
Optionally, enter an informative Description.
-
Choose the aggregation Function. Functions include:
Function Description Summary Count Counts how many runs fit the condition, within a summary tree category. Summary Difference Count Subtracts the summary count of the triaged test suite result from the summary count of the reference test suite result. Summary Percentage Calculates the percentage of runs that fit the condition from a denominator defined in “Percentage Of”, which can be either from all runs or from a specific category. Summary Difference Percentage Subtracts the summary percentage of the triaged test suite result from the summary percentage of the reference test suite result. Unique Value Count Returns the count of unique values for a selected attribute. -
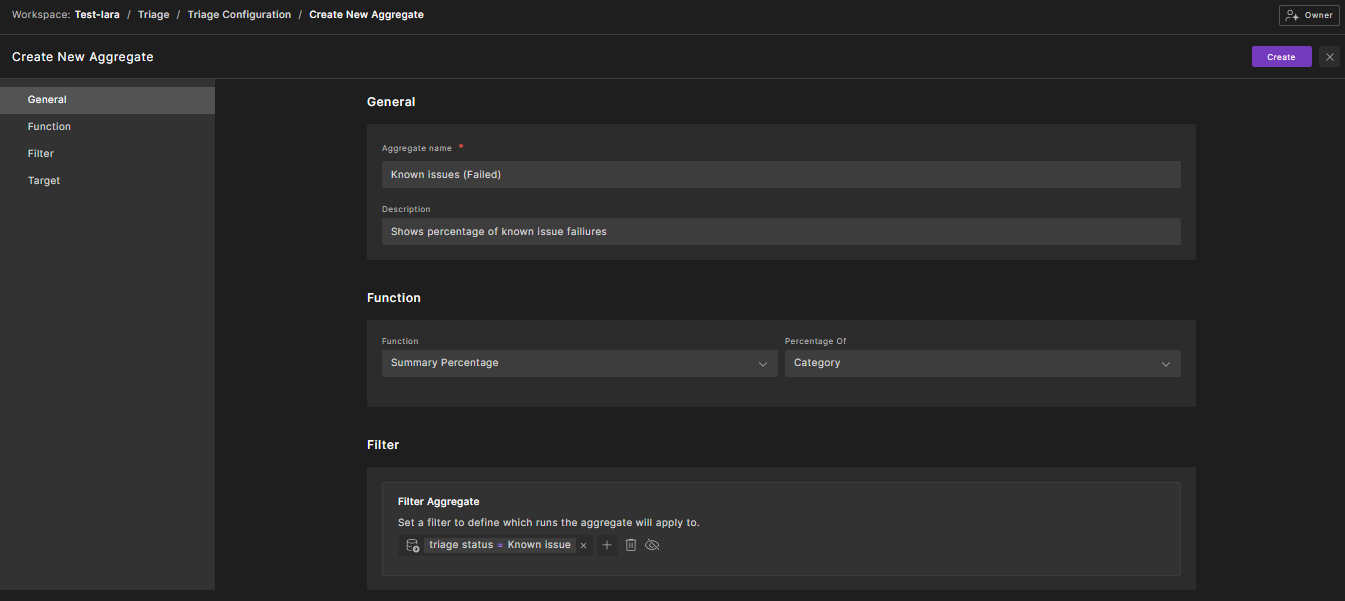
If you selected the Summary Percentage or Summary Difference Percentage function, select All Runs or Category from the Percentage Of dropdown menu.
In this case, you are specifying the denominator for the function—whether you want the function to use the number of runs or the number of items in the category as the denominator.
-
If you selected any of the Summary functions, define the Condition for the aggregation. Click + to add a second condition.
The condition specifies which runs are aggregated by the aggregation function. For details, see Create a triage filter.
-
If you selected Unique Value Count, select the Attribute to be counted.
-
Select the aggregation Target which can be Triaged test suite results or Reference test suite results.
Notes
- The Summary Count and Summary Percentage functions can be applied to either the triaged test suite results or the reference test suite results.
- The Summary Difference Count and Summary Difference Percentage functions can only be applied to the triaged test suite results.
-
Click Create.
62.4 Create Aggregate example
The following example shows how to define an aggregate that calculates the percentage of known issue failures per cluster in the tree:
After clicking Create, the new aggregate appears in the Summary column chooser in the list of available aggregates. You can add it to the Summary table.
Observe the aggregation result:

In this example, the scenario_completion category has its triage status marked as "Known issue", which causes it to show 0% in the "My issues failed %" aggregation column for that category. Note that the percentage is automatically calculated based on the hierarchy within the tree structure.
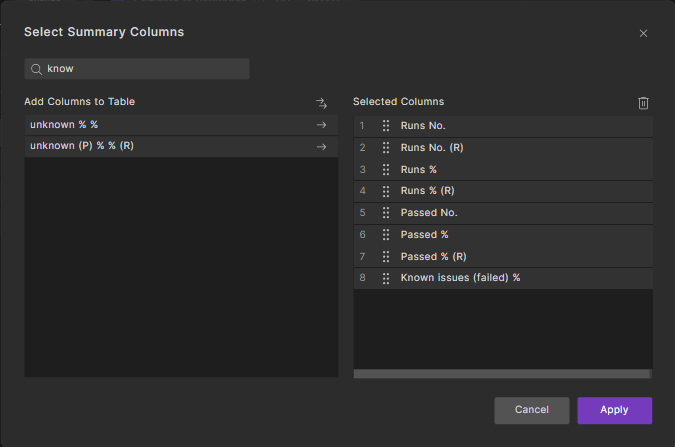
Aggregate types are displayed in the column chooser and summary table by appending the following labels:
- No. for count aggregates
- % for percentage aggregates
- (R) for reference summary attributes