33. Introducing Foretify Manager
The Foretellix Verification and Validation (V&V) environment used together with V-Suites libraries helps you verify the safety of Advanced Driver Assistance Systems (ADAS) or Autonomous Driving (AD) functions.
Foretify Manager, one of the main engines of the V&V environment, provides key capabilities during the test suite execution and results analysis phases of the V&V automated flow.
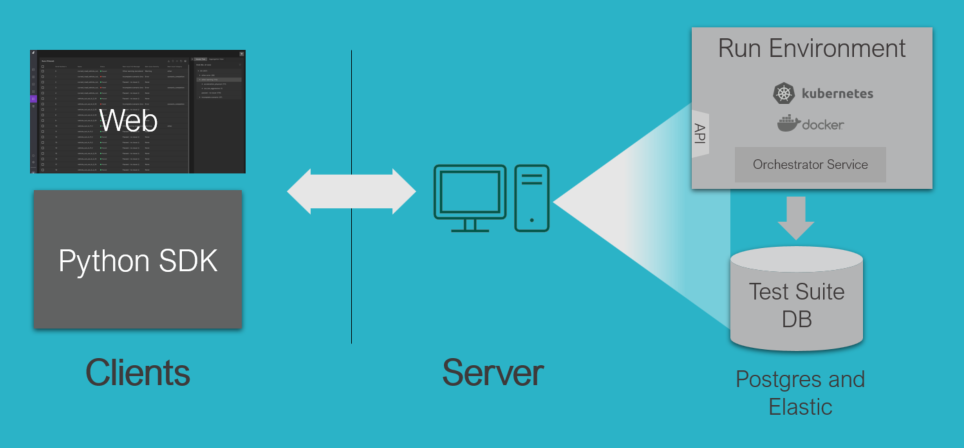
As shown in Figure 1, Foretify Manager is a web-based application with a client-server architecture. Foretify Manager stores uploaded test suite results in PostgreSQL and Elasticsearch databases, provides access to various stored assets such as shared libraries, specifications, and requirements, and supports various clients including a Python client for uploading data and a web-based UI client.
This topic gives a brief overview of the verification tasks you can perform with Foretify Manager. The tasks are then described in more detail in the subsequent topics.
33.1 Access Foretify Manager
To access Foretify Manager:
- Open the Chrome browser.
-
In the URL field, enter the Foretify Manager hostname and port in this format: <ip-address>:<port>. For example:
165.57.41.193:8080 -
Log in to Foretify Manager with your user credentials.
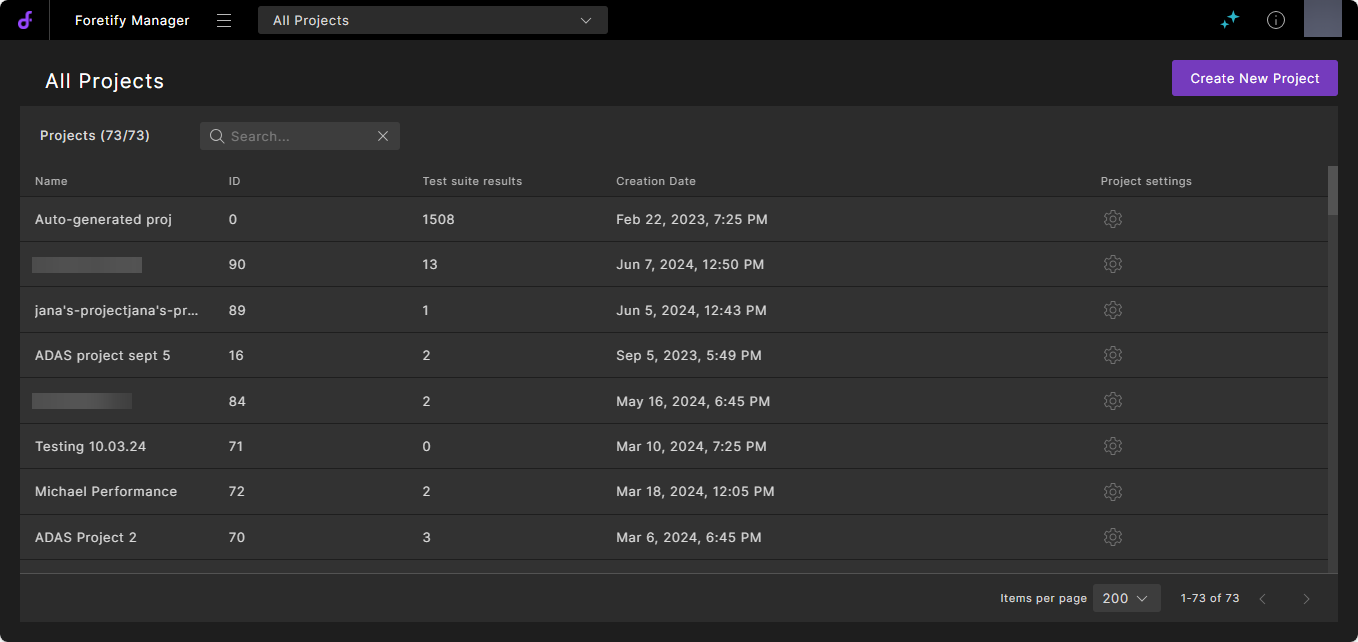
Before you can begin working in Foretify Manager, you need to select or create a project.
-
Click the Projects dropdown list and select a project to work in. Alternatively, you can click Projects, select Go to all and click Create New Project to create a project.
33.2 Task flow
The typical Foretify Manager task flow is as follows:
- Create a project.
- Execute a test suite.
- Create a workspace.
- Triage test suite results.
- Create a verification plan (VPlan).
- Analyze coverage and performance metrics.
- Analyze test suite results over time.
33.3 Create a project
A Foretify Manager project is a hub where your team can collaborate on a verification and validation (V&V) project. You can create a new project, or an owner of a project can add you to their project, granting you permissions to view, edit, or own the project. Within a project, you can perform the tasks described in the following sections, for example, executing a test suite, analyzing run issues, and creating a workspace.
For detailed steps, see Working with projects.
33.4 Execute a test suite
You can launch a test suite in Foretify Manager by submitting a test suite configuration consisting of:
- A set of run tables that configure the tests you want to execute.
- Environment settings that identify the execution platform and so on.
Foretify Manager then calls the Dispatcher to submit the jobs to Foretify so that they execute concurrently on multiple network nodes.
To access your test suites, log into Foretify Manager, select or create a project, and click Results > Test Suite Results. The accessible test suite executions will be displayed.
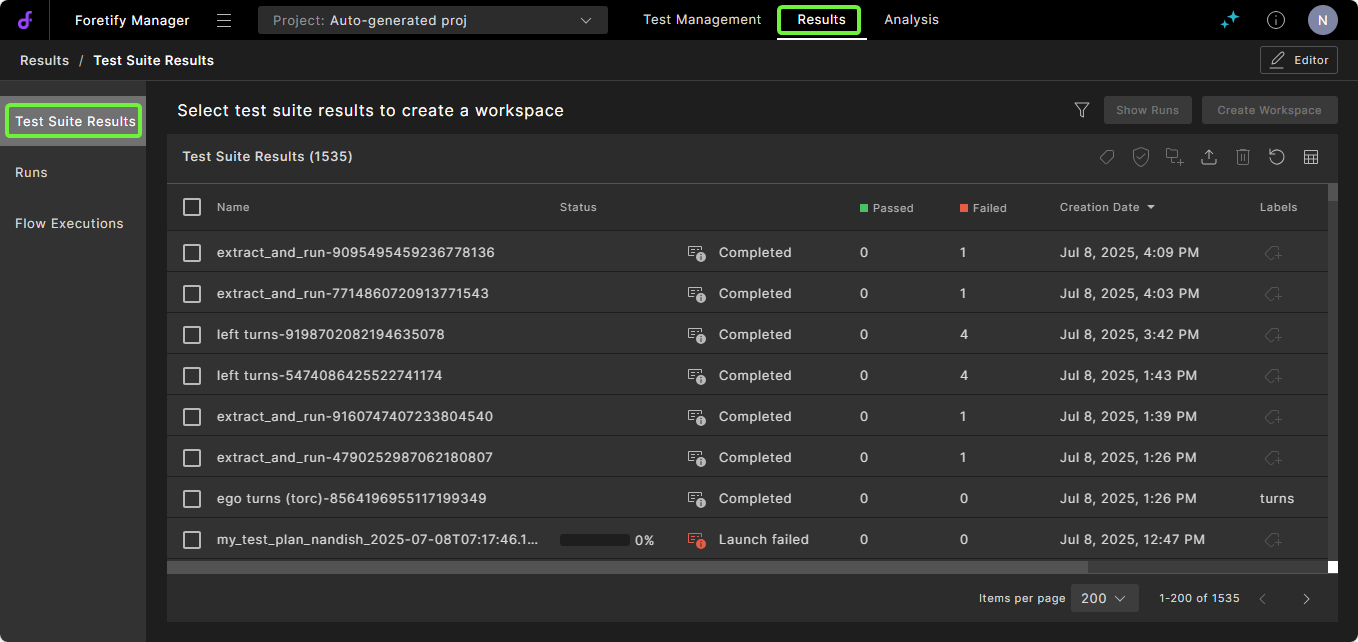
You can relaunch a previously defined test suite or define and launch a new one. You can also select one or more of the test suites and then either show the run results or create a workspace.
For detailed steps, see Launching a test suite.
33.5 Analyze run issues
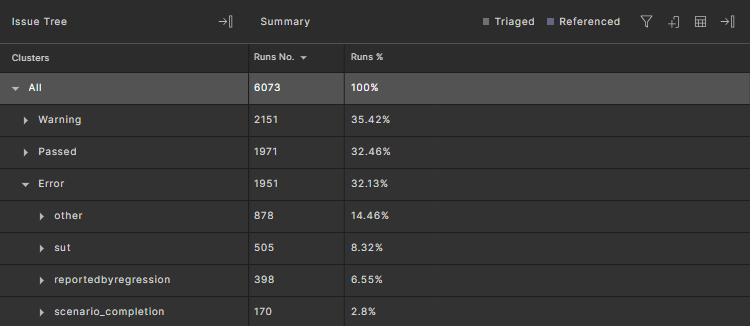
Foretify Manager helps you quickly identify common issues across a test suite. After you select one or more test suite executions in the Test Suite Results tab and click Show Runs, the Runs tab opens, displaying a table listing all the runs in the selected test suites.
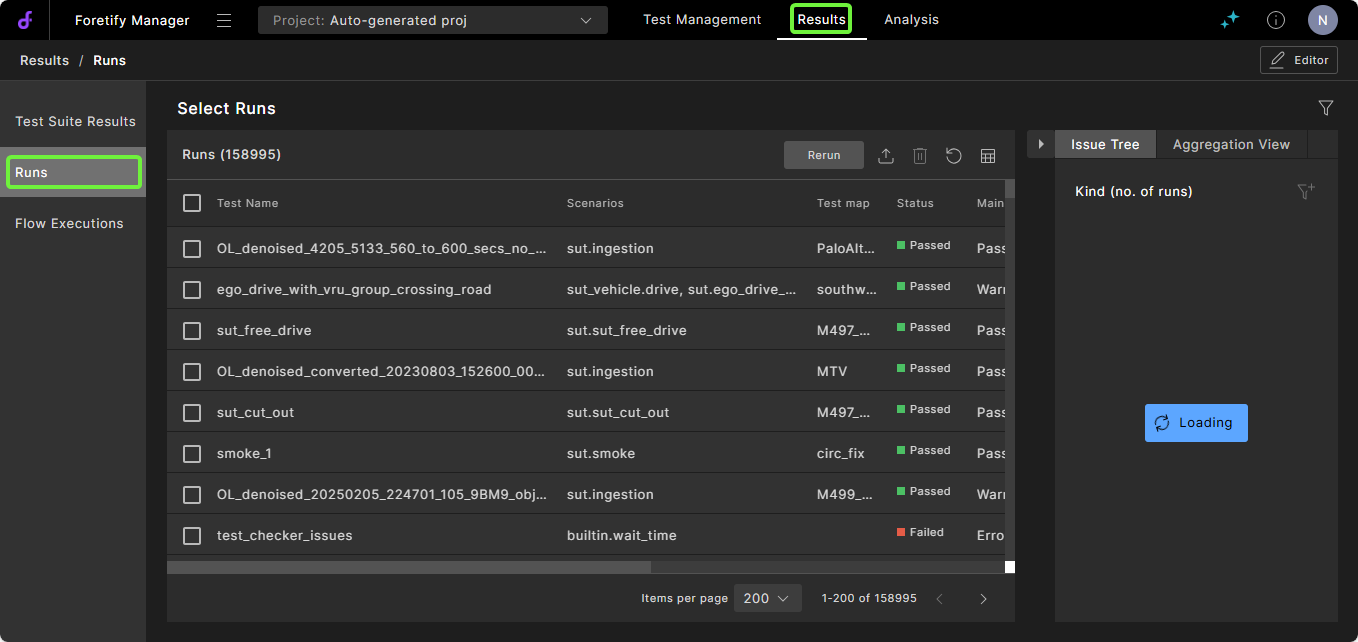
The Issues Tree to the right of the table displays a hierarchical list of issues that occurred during the selected test suite executions, ordered by category, such as SUT Error, Other Error and SUT Warning.
If you click on a run listed in the table, the Debug Run window opens, displaying the selected run in the Visualizer. Additional run information, such as traces and metrics, is also displayed.
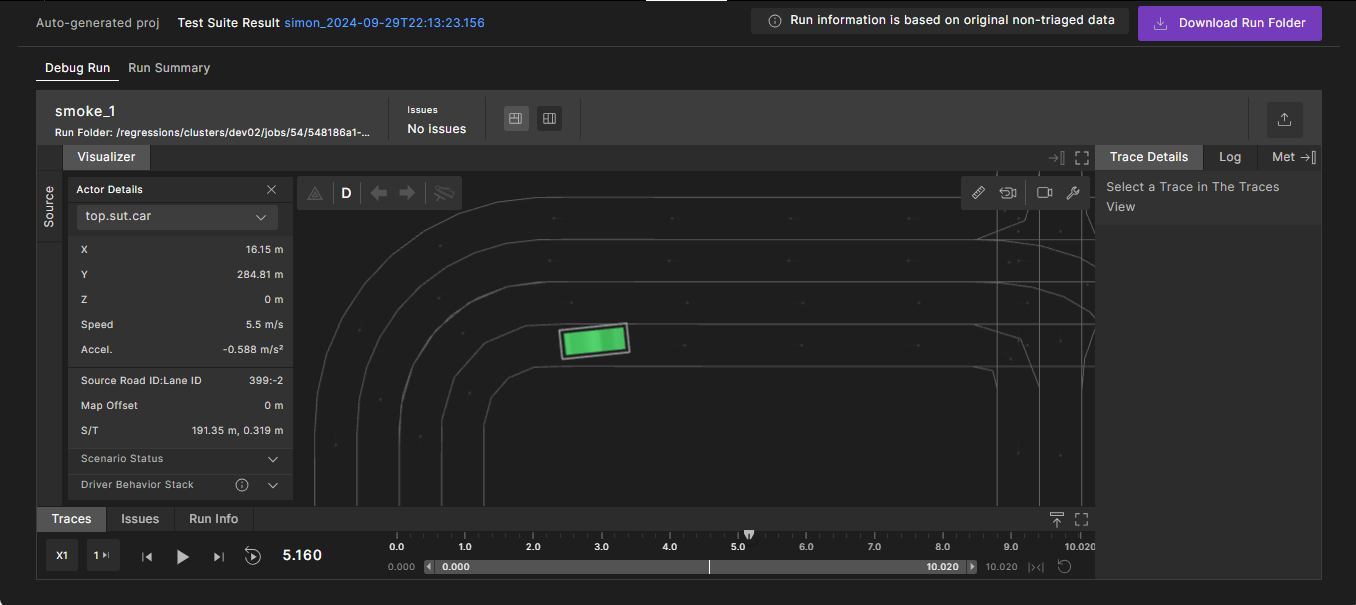
The Visualizer displays the actors in the scenario on the map used for that run, and lets you move back and forth on the run timeline to pinpoint the possible source of an issue.
For detailed steps, see Debug a run.
33.6 Create a workspace
Once you have executed a test suite a number of times and debugged it to your satisfaction, you can create a workspace. A workspace is a persistent context for analyzing both the run issues and the metrics for the selected test suite executions.
You create a workspace by navigating to the Analysis tab in your project and clicking Create Workspace. You can then configure a Capture rule to specify what test suite results to add to the workspace. You can add test suite results explicitly. You can configure permissions in order to share your workspace. The Workspace window displays the metrics for the test suite executions included in the workspace.
Test suite metrics are displayed in the context of a verification plan (VPlan). When you create a workspace, you can either choose the default VPlan (the aggregated metrics model for all the runs in the test suite), or create a custom VPlan for your project.
For detailed steps, see Creating a workspace.
33.7 Triage test suite results
Once you have created a workspace, you can use the Triage view to cluster your Foretify runs and further analyze and debug them at a granular level. You can assign attributes to runs and you can create triage rules that let you perform actions based on conditions. For example, you can set custom attributes based on other attributes. From Triage, you can also launch a run in Visualizer and use the single-run debugger to investigate issues.
For detailed steps, see Triaging test suite results.
33.8 Create a VPlan
At the beginning of a project, the default VPlan for a test suite might be sufficient to give you a general sense of the progress for a particular test suite.
However, to focus your analysis on metrics and issues that are most critical to your project, it is best to create a customized VPlan using the VPlan editor.
You can create a hierarchical VPlan at the start of a project and gradually fill in the hierarchy with run data as the project develops. Alternatively, you can create an initial VPlan based on a test suite with only a few runs of a few scenarios and gradually expand the VPlan hierarchy as the project develops. With either approach, writing a VPlan is an iterative process.
For detailed steps, see Creating VPlans.
33.9 Analyze metrics
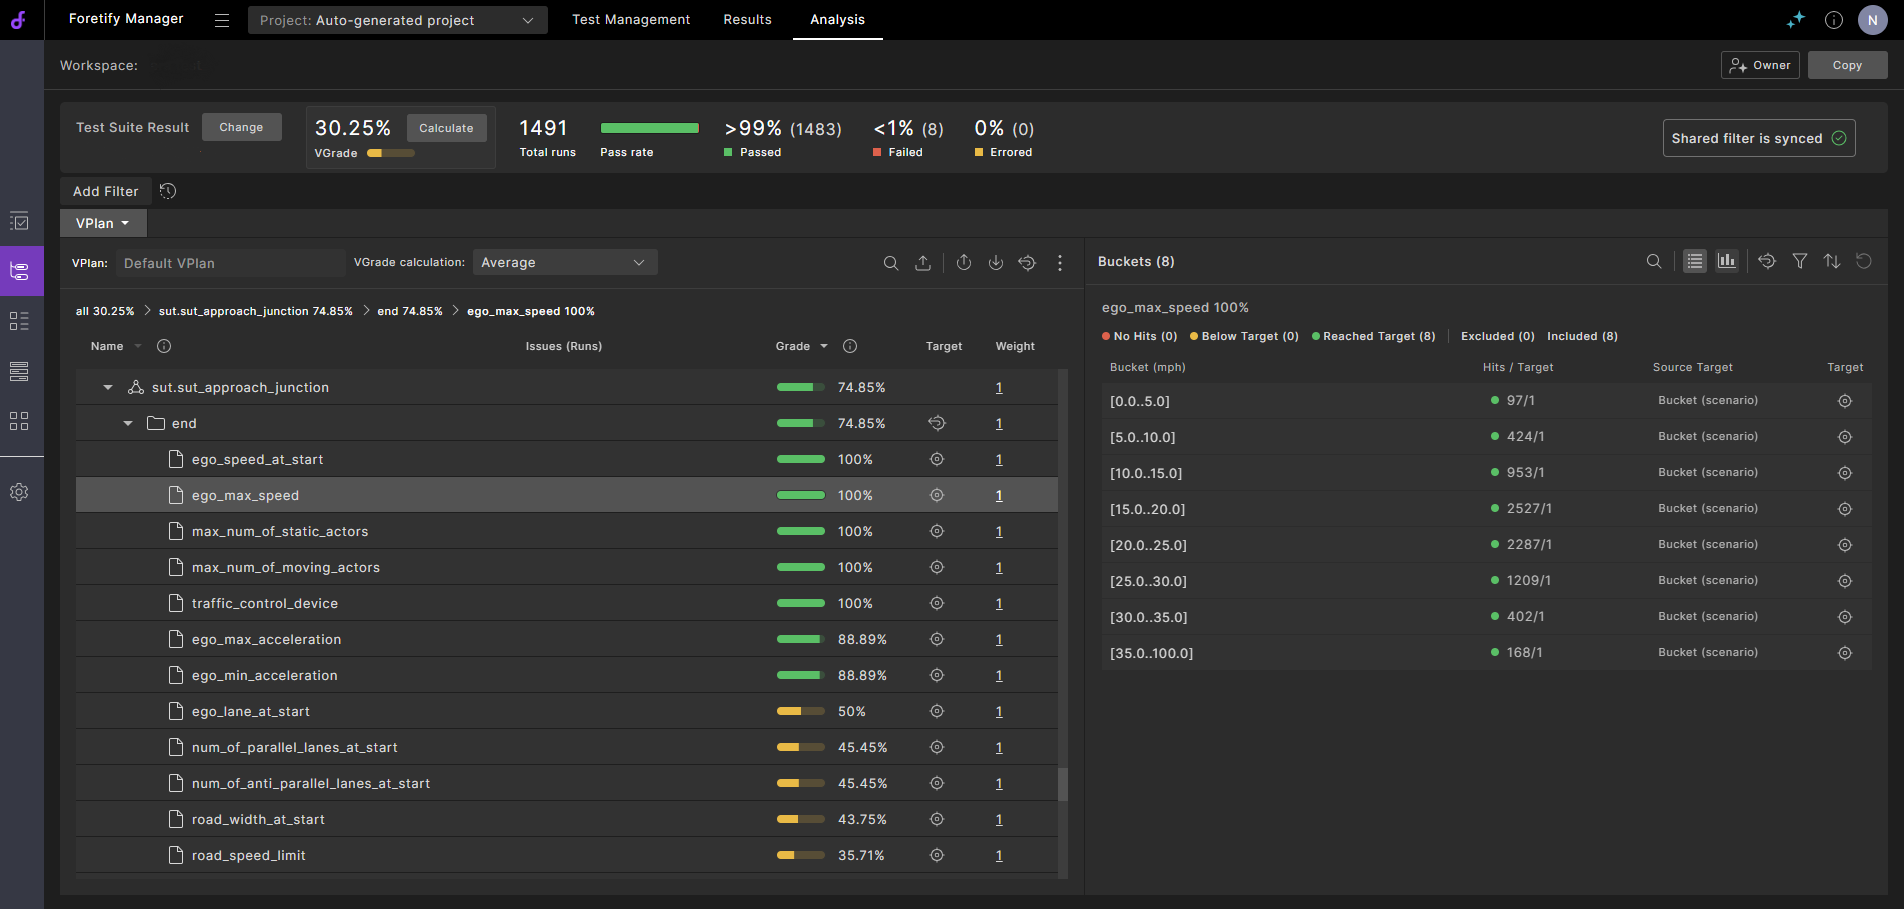
The VPlan tab displays the VPlan annotated with metrics data collected during the runs. The collected metrics help you answer two critical questions:
- How well was the SUT tested?
- How well did the SUT perform within these tests?
The first question is answered by the coverage grade (VGrade), the multi-dimensional representation of all situations encountered during testing. The second question is answered by the collection of Key Performance Indicators (KPIs).
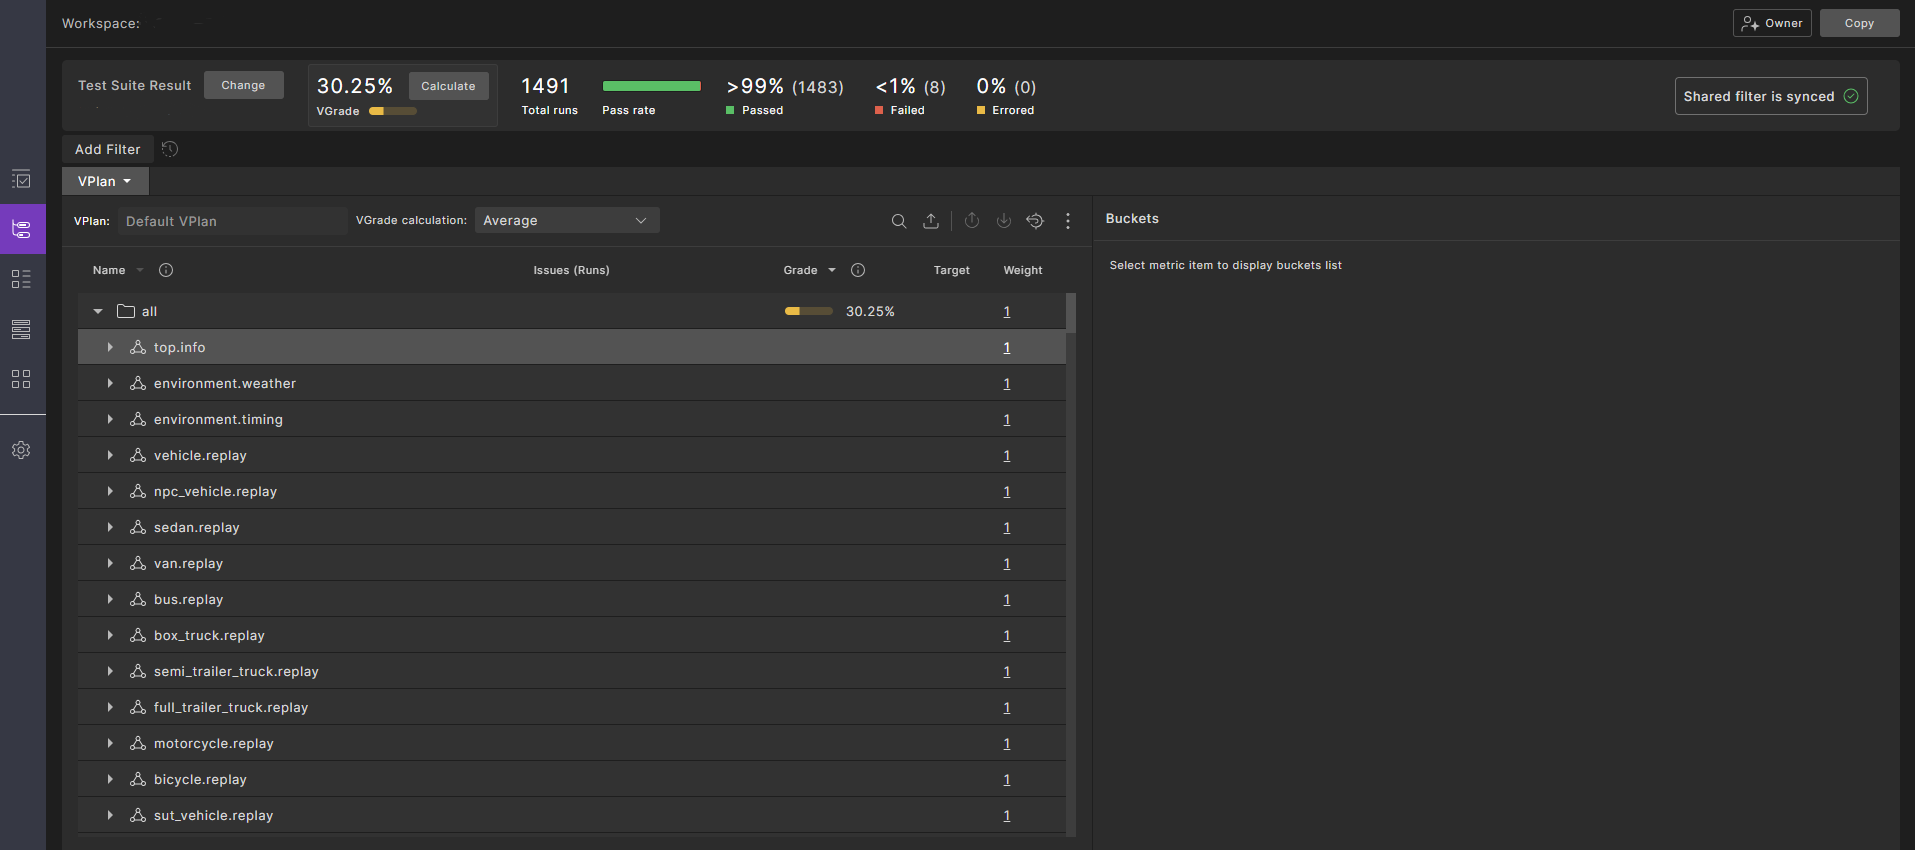
The overall VGrade is calculated based on the individual grades for all items in the metrics model. The colors red, yellow and green are used to indicate entities with low, medium and high grades. Following is the VPlan tab of the Workspace window.
From the VPlan tab, you can perform various tasks such as identifying areas that need more testing, identifying KPIs that are not meeting expectations, and so on.
For detailed steps, see Analyzing metrics.