66. Working with VPlans
A VPlan is a machine-readable verification plan that facilitates analysis by organizing metrics and run data into a hierarchical framework.
Using a top-down approach, you can create a hierarchical VPlan at the start of a project and gradually fill in the hierarchy as you create scenarios and define metric items. Alternatively, using a bottom-up approach, you can create an initial VPlan based on a test suite with even a few runs of a few scenarios. Then, as you gradually increase the number of scenarios, you update the VPlan to expand the hierarchy. With either approach, writing a VPlan is an iterative process.
Figure 1 shows the VPlan Editor with some VPlan sections already defined in the left pane and the metrics collected during test suite execution (the Metrics Model) in the right pane.
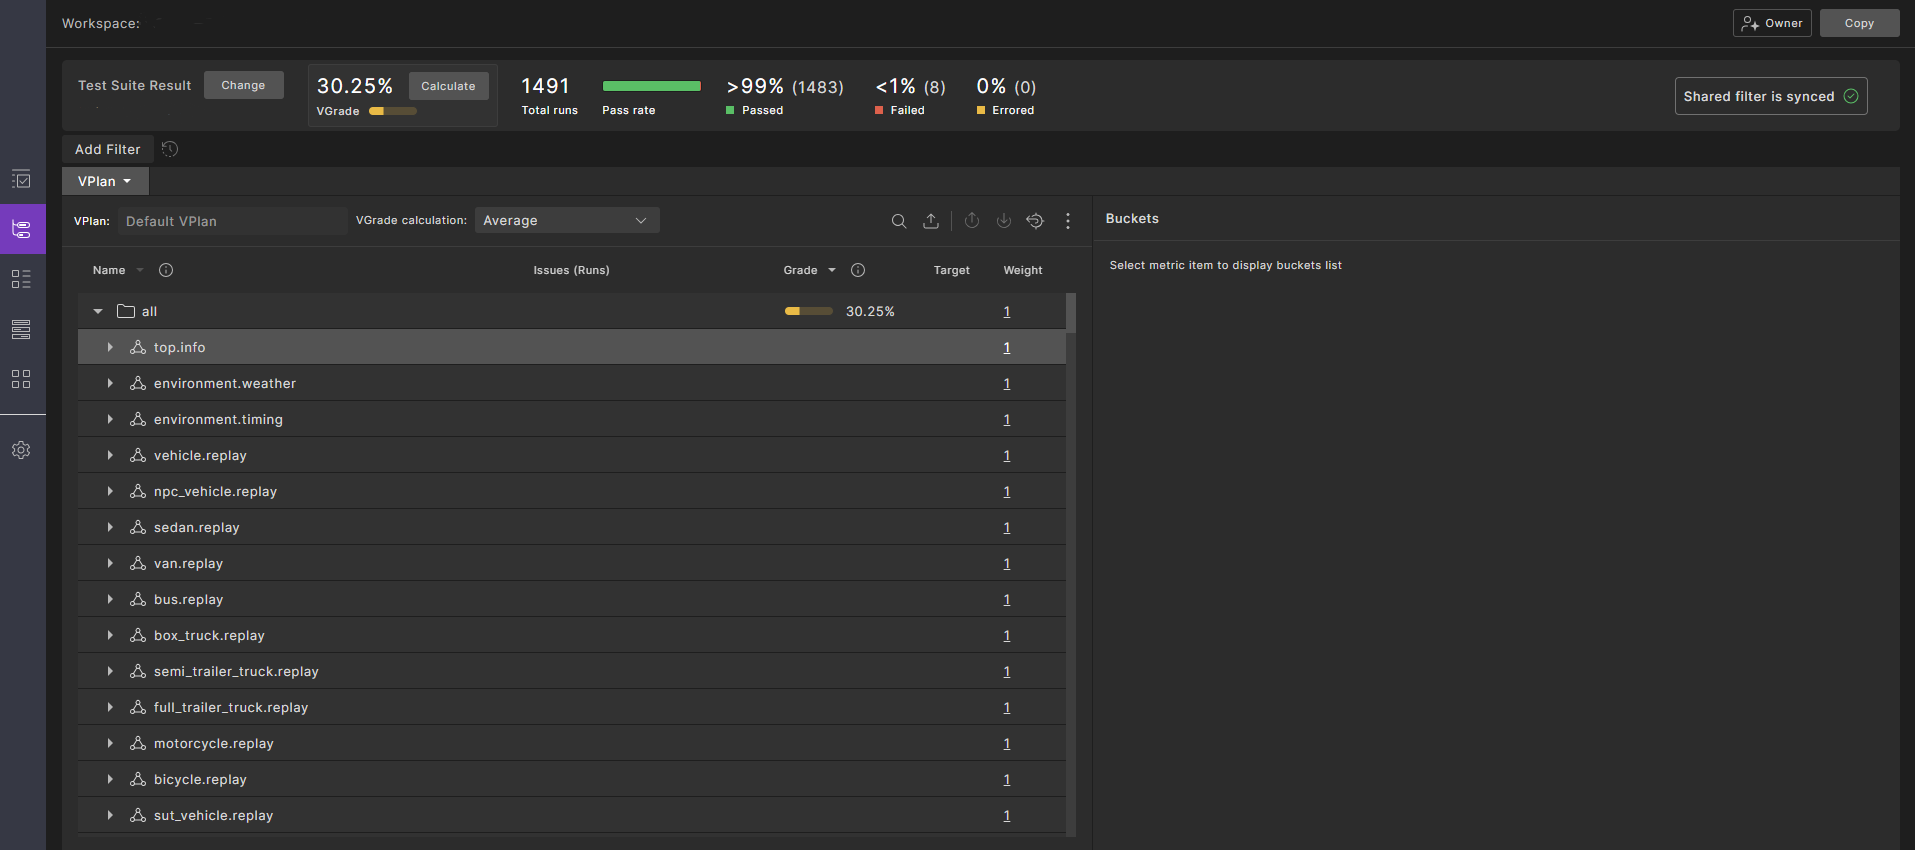
To open the VPlan Editor, do one of the following:
- Click the hamburger icon at the top of the window, and then click VPlans.
- Click the VPlan tab of your workspace and select Edit VPlan or, if you haven't yet created a VPlan, select Create New Vplan from the list of VPlan options.
You can perform the following tasks related to the VPlan Editor:
- Create a VPlan
- Edit a VPlan
- Modify section attributes
- Manage VPlans
- Link a VPlan to project requirements
66.1 VPlan Structure and Content
When you upload a test suite, Foretify Manager generates a default VPlan and a metrics model based on the metrics defined in the suite. You can use the default VPlan or create a custom VPlan to suit your needs.
The default VPlan and the metrics model include all the scenarios defined in the test suite, including not only user-defined scenarios but also lower-level scenarios such as vehicle.drive().
The default VPlan and the metrics model also include a top.info struct that contains information about the test suite, such as the SUT and Foretify versions, the maps used, and the main issues (errors, warnings, and so on) in the test suite.
As shown in Figure 2, the top-level entities of the metrics model in a VPlan are scenarios named <actor>.<scenario> and marked with a vector icon.
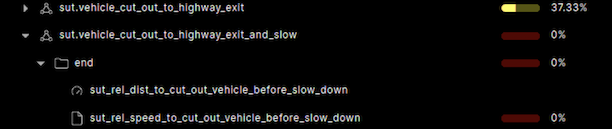
Under each scenario, you will find:
- One or more events, including the predefined end event, marked with a folder icon
- Cover metric items, marked with a page icon
- Record metric items (KPIs), marked with a meter icon and located under their associated event
You can add entities to the VPlan that are not part of the metrics model. For example, there are no metric items associated with checkers. However, in order to make the VPlan complete, you can note where checkers are defined by creating a checker section and adding checkers to that section, such as those defined with collect().