Analyzing Test Suite Results
The Analysis page in Foretify Manager provides a consolidated view of coverage and performance trends over time for V&V engineers and managers. It helps teams to monitor verification progress, confirm they are moving in the correct direction, and quickly identify areas that require attention.
The Analysis page offers key benefits:
- Track verification progress: Review aggregated coverage and performance trends to quickly assess progress over time.
- Identify coverage gaps and test quality: Compare pass rate and VGrade trends to correlate test execution success with the actual coverage achievement and highlight where gaps remain.
- Support recalculation decisions: Review VPlan version information alongside results to determine when results may be outdated and require recalculation.
Use the Analysis page to:
-
Track verification progress over time: Trend charts make it easy to monitor daily changes in pass rates and coverage, and quickly drill into specific Test Suite Results (TSRs) when you see unexpected drops.
-
Support milestone and stakeholder reviews: VGrade trends provide a clear, quantitative summary of coverage progress, while pass rate trends highlight test quality improvements for demos, design reviews, and formal milestones.
-
Ensure analyses stay up to date: The VPlan Version column helps you spot results calculated with older VPlan versions, so you can prioritize recalculation and keep your coverage and metrics aligned with the latest methodology.
-
Evaluate impact of changes with confidence: By adjusting the Number of Results filter, you can compare runs across different time windows and directly assess how configuration changes affect behavior and quality.
The Analysis page operates within a specific workspace. To navigate to the Analysis page, click the Workspace Test Suite Results icon. The workspace name appears at the top of the page, and all displayed trends and results are scoped to that workspace.
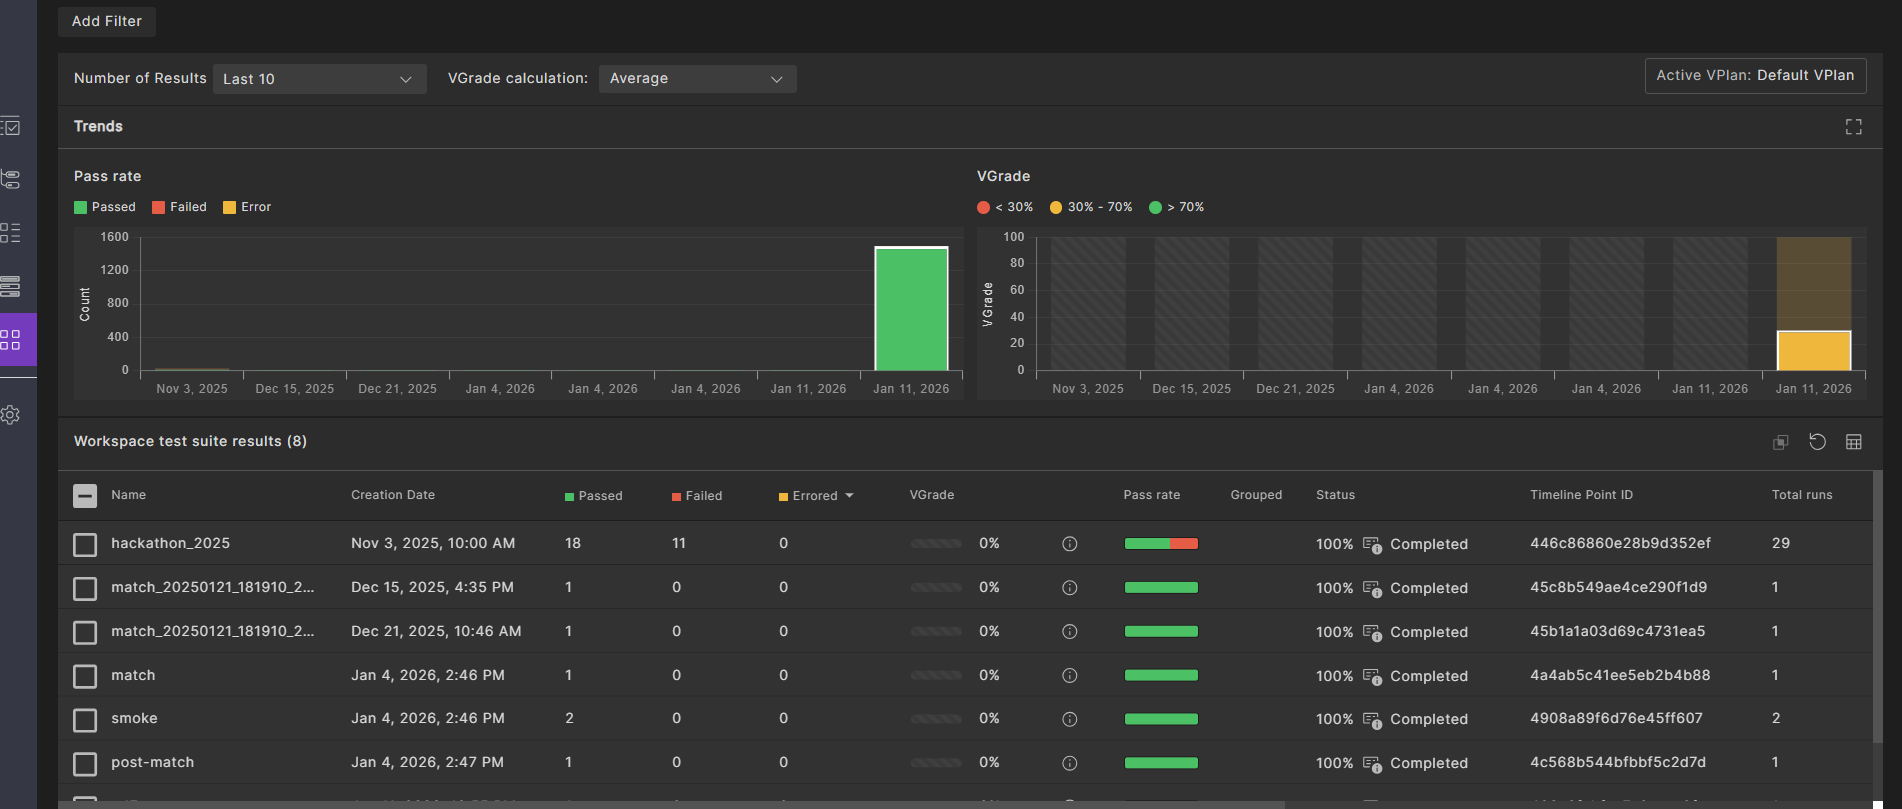
Filters and Controls on the Analysis page
Controls at the top of the Analysis page let you customize the view:
- Number of Results: Specifies how many timeline points from the workspace appear in the trend charts.
- VGrade calculation: Defines how VGrade values are calculated when multiple results are available in the workspace.
- Workspace VPlan: Shows which VPlan is currently active for the workspace and used for VGrade and coverage calculations.
- Add Filter: Applies additional filters on the workspace test suite results to narrow the displayed results to a focused subset.
Trends on the Analysis page
The Trends area of the Analysis page includes two complementary visualizations:
-
Pass rate chart: Displays test execution outcomes over time as stacked bar charts.
- Green indicates passed tests
- Red indicates failed tests
- Yellow indicates errors
-
VGrade chart: Displays coverage progress over time.
- Red indicates low coverage
- Yellow indicates medium coverage
- Green indicates high coverage
Test suite results on the Analysis page
The Workspace test suite results table appears below the trend charts and lists the individual Test Suite Results (TSRs) that populate the Analysis view. You can customize the which columns are shown using the available result attributes.
| Attribute | Description |
|---|---|
| Name | Test Suite Result identifier |
| Status | Completion state and percentage |
| Passed | Number of passed tests |
| Failed | Number of failed tests |
| Creation Date | Date when the TSR was created |
| Labels | Applied labels |
| Grouped | Grouping indicator |
| Timeline Point ID | Associated timeline point |
| Test Suite Results ID | Unique identifier |
| Errored | Number of tests with errors |
| Last Calculated Date | Date when metrics were last calculated |
| Pass Rate | Percentage of passed tests, shown with a progress bar |
| Test Plans | Associated test plans |
| Total Runs | Total number of test runs |
| VGrade | Coverage score with a visual indicator |
| VPlan Name | Associated verification plan name |
| VPlan Version | Verification plan version used for calculation |
Tips for effective use of the Analysis page
- Review trends regularly to detect issues early.
- Analyze pass rate and VGrade together for a complete view of verification status. A high pass rate with a low VGrade may indicate insufficient coverage.
- Use filters strategically to focus on specific issues.
- Track VPlan version changes to determine when recalculation is required.